

Question
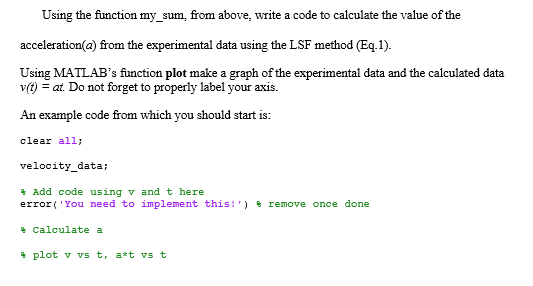
Hi! I'm a novice at matlab and don't know how to answer this question. Step by step codes please. Thanks! The data is : t
Hi! I'm a novice at matlab and don't know how to answer this question. Step by step codes please. Thanks!
The data is :
t = (0:0, 25:3)
v = (0, 2.6, 5.05, 7.49, 9.60, 12.22, 14.10, 17.50, 19.80, 22.05, 25.50, 25.95, 29.50)
Step by Step Solution
There are 3 Steps involved in it
Step: 1

Get Instant Access to Expert-Tailored Solutions
See step-by-step solutions with expert insights and AI powered tools for academic success
Step: 2

Step: 3
Ace Your Homework with AI
Get the answers you need in no time with our AI-driven, step-by-step assistance
Get Started
Murach's SQL Server 2012 For Developers
Authors: Bryan Syverson, Joel Murach, Mike Murach
1st Edition
1890774693, 9781890774691