

Answered step by step
Verified Expert Solution
Question
1 Approved Answer
hi please answers 2 question and show all your work thank you. h. Now we'll evaluate how Batman and Robin have gained from trade. On
hi please answers 2 question and show all your work thank you. 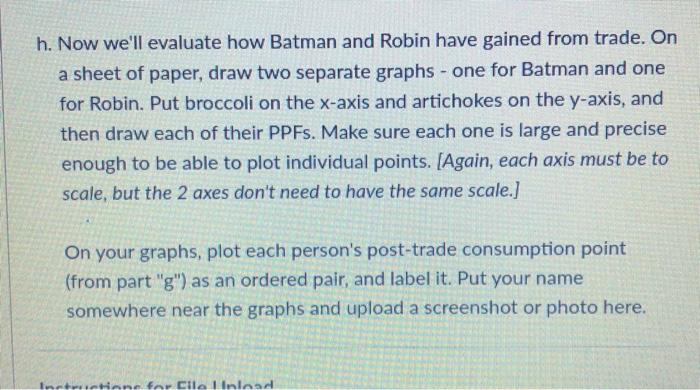
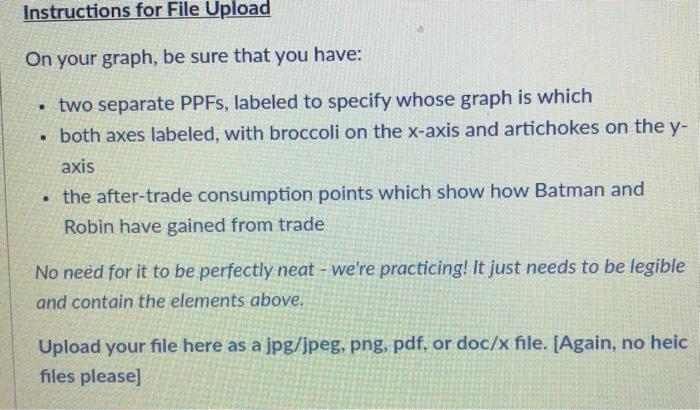
h. Now we'll evaluate how Batman and Robin have gained from trade. On a sheet of paper, draw two separate graphs - one for Batman and one for Robin. Put broccoli on the x-axis and artichokes on the y-axis, and then draw each of their PPFs. Make sure each one is large and precise enough to be able to plot individual points. [Again, each axis must be to scale, but the 2 axes don't need to have the same scale.] On your graphs, plot each person's post-trade consumption point (from part "g") as an ordered pair, and label it. Put your name somewhere near the graphs and upload a screenshot or photo here. On your graph, be sure that you have: - two separate PPFs, labeled to specify whose graph is which - both axes labeled, with broccoli on the x-axis and artichokes on the y axis - the after-trade consumption points which show how Batman and Robin have gained from trade No need for it to be perfectly neat - we're practicing! It just needs to be legible and contain the elements above. Upload your file here as a jpg/jpeg, png, pdf, or doc/x file. [Again, no heic files please] We'll now look back at the market for peanut butter. The following questions offer a list of scenarios, and you're asked to determine the effect on supply, demand, equilibrium price, and equilibrium quantity in the pizza market. Remember that a change in price results in movement along the S and D curves (changes in Qs and Qd, as we saw in the previous problems). A change in a non-price determinant will shift one of the curves and result in a new equilibrium (changes in supply and/or demand). For each of the scenarios with non-price determinants, sketch a graph and show the shift of the curve(s) and how equilibrium is affected. Once you've Show your work! Upload a picture of your graphs from the 3 scenarios above. You should have three separate graphs. These can be simple sketches, but make sure on each graph that you: - Label both axes (P and Q) - Clearly show the curves shifting - Mark both the old equilibrium and the new equilibrium - Include your name somewhere on the image As with the previous uploads, please upload as a jpg/jpeg, png, pdf, or doc/ / file. leflect on your graph in 2-3 sentences, answering the questions below. i. Where are Batman and Robin's consumption points located in relation to their PPFs? How do these points compare to what each would have been able to produce individually? Briefly explain what that tells us about gains from trade. j. Bonus: What does this problem tell us about absolute advantage and gains from trade? In other words, if one individual has an absolute advantage at producing both goods, can they still gain from trade? Why? h. Now we'll evaluate how Batman and Robin have gained from trade. On a sheet of paper, draw two separate graphs - one for Batman and one for Robin. Put broccoli on the x-axis and artichokes on the y-axis, and then draw each of their PPFs. Make sure each one is large and precise enough to be able to plot individual points. [Again, each axis must be to scale, but the 2 axes don't need to have the same scale.] On your graphs, plot each person's post-trade consumption point (from part "g") as an ordered pair, and label it. Put your name somewhere near the graphs and upload a screenshot or photo here. On your graph, be sure that you have: - two separate PPFs, labeled to specify whose graph is which - both axes labeled, with broccoli on the x-axis and artichokes on the y axis - the after-trade consumption points which show how Batman and Robin have gained from trade No need for it to be perfectly neat - we're practicing! It just needs to be legible and contain the elements above. Upload your file here as a jpg/jpeg, png, pdf, or doc/x file. [Again, no heic files please] We'll now look back at the market for peanut butter. The following questions offer a list of scenarios, and you're asked to determine the effect on supply, demand, equilibrium price, and equilibrium quantity in the pizza market. Remember that a change in price results in movement along the S and D curves (changes in Qs and Qd, as we saw in the previous problems). A change in a non-price determinant will shift one of the curves and result in a new equilibrium (changes in supply and/or demand). For each of the scenarios with non-price determinants, sketch a graph and show the shift of the curve(s) and how equilibrium is affected. Once you've Show your work! Upload a picture of your graphs from the 3 scenarios above. You should have three separate graphs. These can be simple sketches, but make sure on each graph that you: - Label both axes (P and Q) - Clearly show the curves shifting - Mark both the old equilibrium and the new equilibrium - Include your name somewhere on the image As with the previous uploads, please upload as a jpg/jpeg, png, pdf, or doc/ / file. leflect on your graph in 2-3 sentences, answering the questions below. i. Where are Batman and Robin's consumption points located in relation to their PPFs? How do these points compare to what each would have been able to produce individually? Briefly explain what that tells us about gains from trade. j. Bonus: What does this problem tell us about absolute advantage and gains from trade? In other words, if one individual has an absolute advantage at producing both goods, can they still gain from trade? Why Step by Step Solution
There are 3 Steps involved in it
Step: 1

Get Instant Access to Expert-Tailored Solutions
See step-by-step solutions with expert insights and AI powered tools for academic success
Step: 2

Step: 3
Ace Your Homework with AI
Get the answers you need in no time with our AI-driven, step-by-step assistance
Get Started
Quality Assessment Manual For The Internal Audit Activity
Authors: The Internal Audit Foundation
2017 Edition
0894139975, 978-0894139970