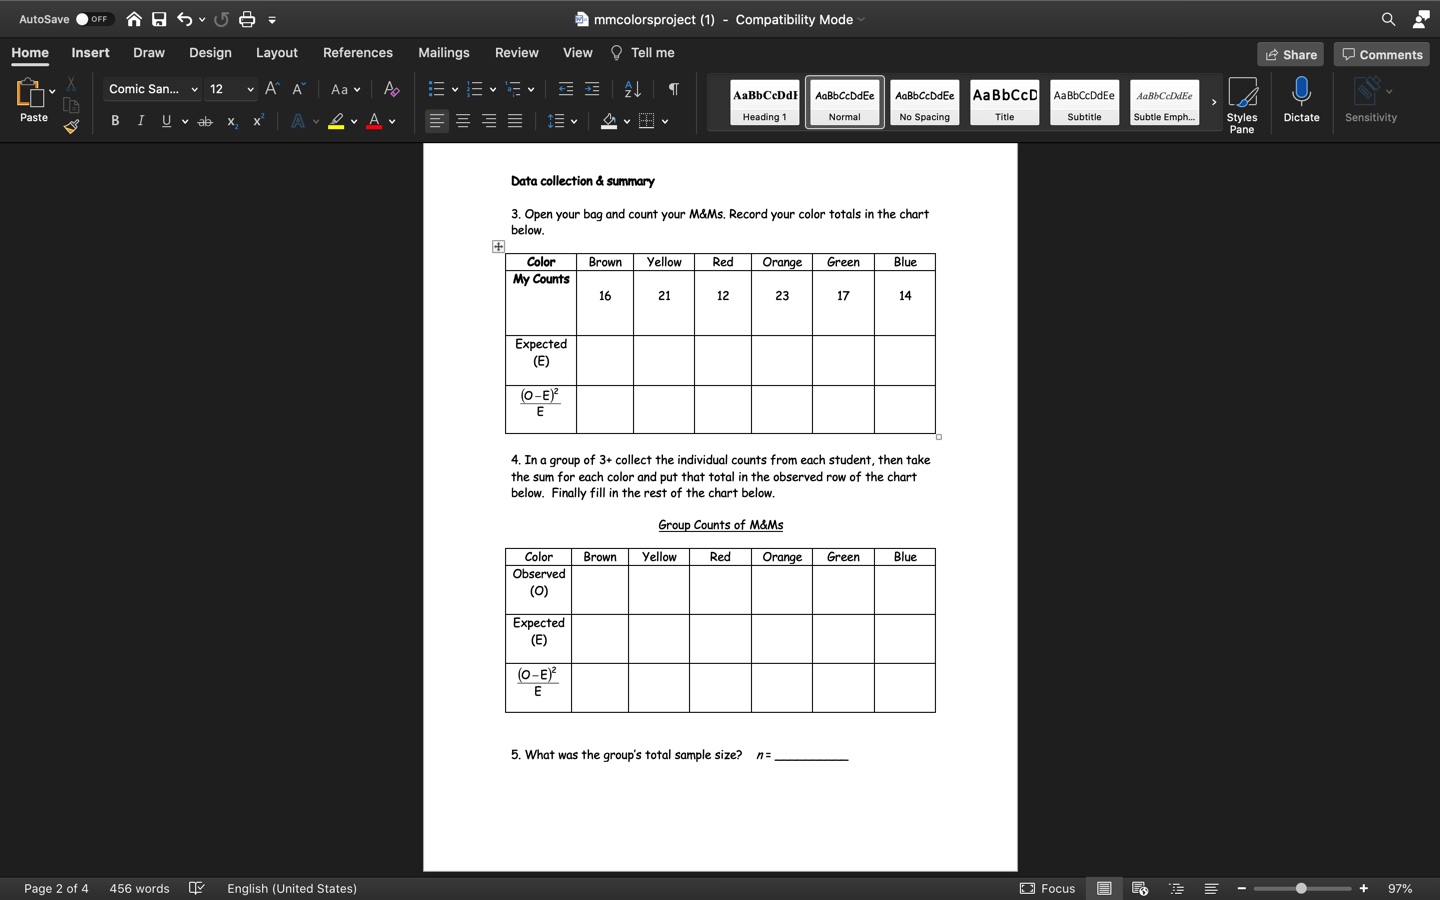
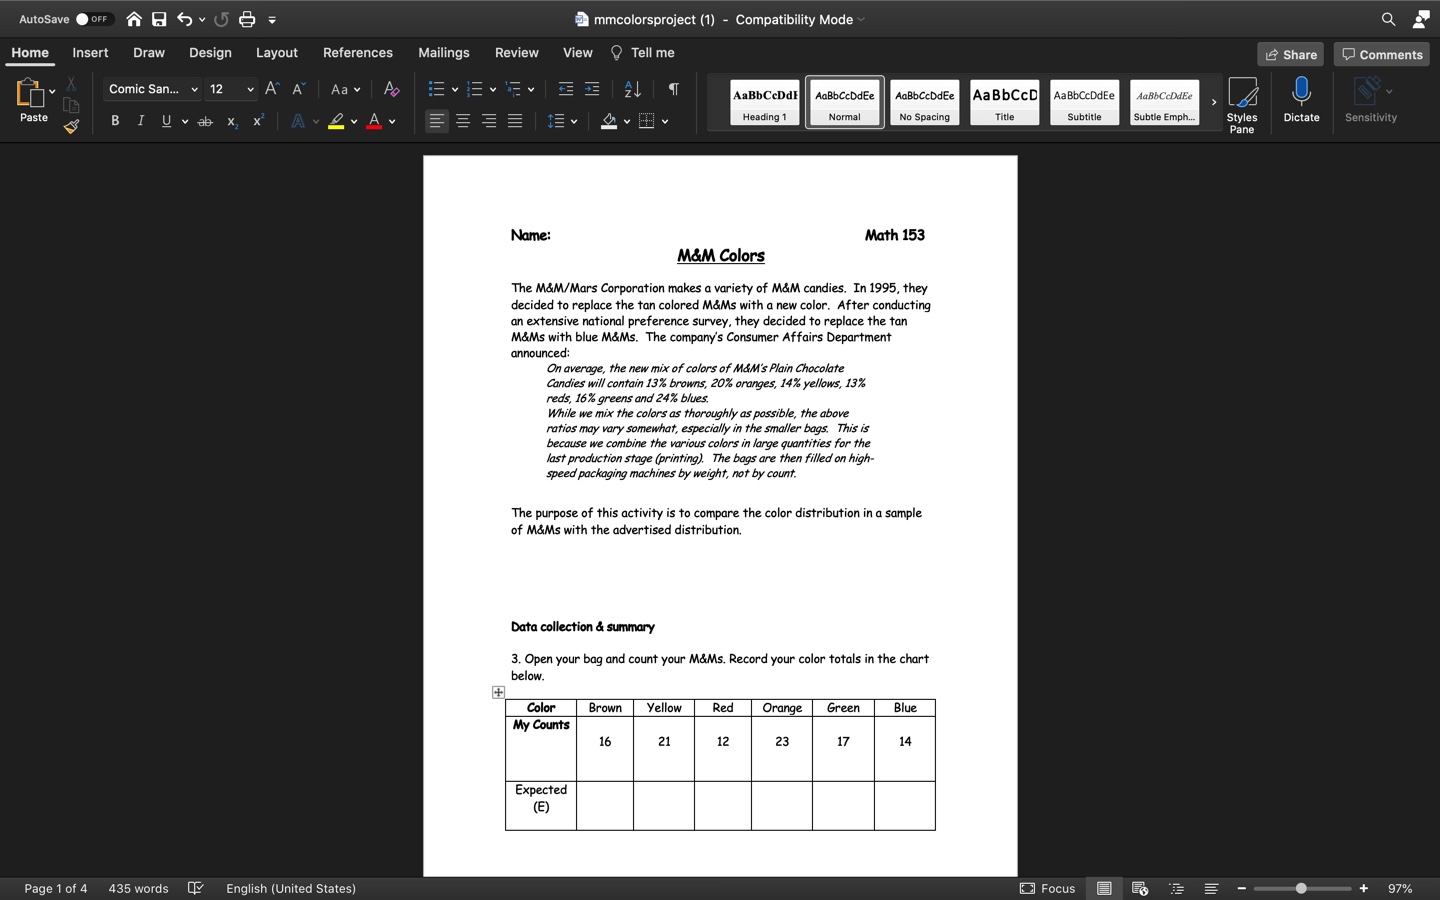
hi so I have a quick question I did the "my counts" portion with my pack of m&ms, how would I find the expected (E) portion Would I take what's given on the first page?
AutoSave . OFF mmcolorsproject (1) - Compatibility Mode Q Home Insert Draw Design Layout References Mailings Review View Tell me Share Comments Comic San... 12 Aa v AaBbCcDdF AaBbCcDdEe AaBbCcDdEe AaBbCCD AaBbCcDdEe AaBbCcDdEe Paste BIU A ~ A v Heading 1 Norma No Spacing Title Subtitle Subtle Emph styles Dictate Sensitivity Pan Data collection & summary 3. Open your bag and count your M&Ms. Record your color totals in the chart below. Color Brown yellow Red Orange Green Blue My Counts 16 21 12 23 17 14 Expected (E) (0-E) 4. In a group of 3+ collect the individual counts from each student, then take the sum for each color and put that total in the observed row of the chart below. Finally fill in the rest of the chart below. Group Counts of M&Ms Color Brown yellow Red Orange Green Blue Observed (O) Expected (E) (0-E) E 5. What was the group's total sample size? n=_ Page 2 of 4 456 words English (United States) Focus 97%AutoSave . OFF mmcolorsproject (1) - Compatibility Mode Q Home Insert Draw Design Layout References Mailings Review View Tell me Share Comments Comic San... 12 Aa v AaBbCcDdF AaBbCcDdEe AaBbCcDdEe Aa BbCCD AaBbCcDdEe AaBbCcDdEe Paste BIU A A v Heading 1 Norma No Spacing Title Subtitle Subtle Emph styles Dictate Sensitivity Pan Name: Math 153 M&M Colors The M&M/Mars Corporation makes a variety of M&M candies. In 1995, they decided to replace the tan colored M&Ms with a new color. After conducting an extensive national preference survey, they decided to replace the tan M&Ms with blue M&Ms. The company's Consumer Affairs Department announced: On average, the new mix of colors of MAM's Plain Chocolate Candies will contain 13% browns, 20%% oranges, 14% yellows, 13%% reds, 16% greens and 24%% blues. While we mix the colors as thoroughly as possible, the above ratios may vary somewhat, especially in the smaller bags. This is because we combine the various colors in large quantities for the last production stage (printing). The bags are then filled on high- speed packaging machines by weight, not by count. The purpose of this activity is to compare the color distribution in a sample of M&Ms with the advertised distribution. Data collection & summary 3. Open your bag and count your M&Ms. Record your color totals in the chart below. Color Brown yellow Red Orange Green Blue My Counts 16 21 12 23 17 14 Expected (E) Page 1 of 4 435 words English (United States) Focus 97%