Hi tutors, I need help tointerpret, discuss and report the answers. Thanks!
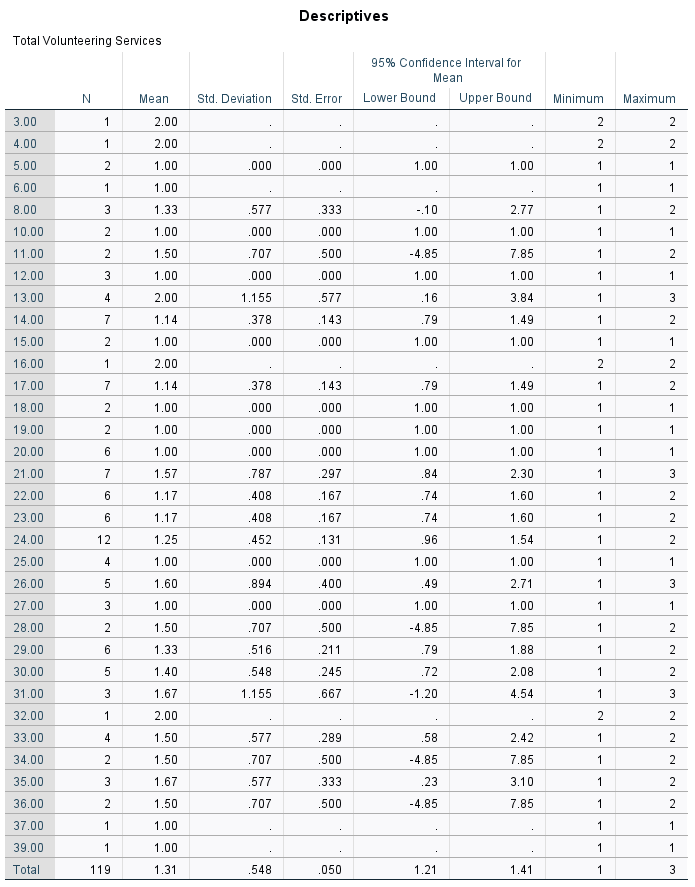
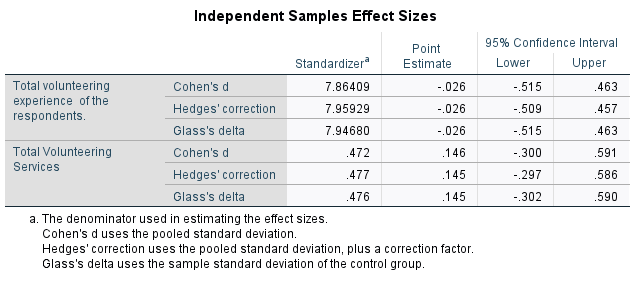
We are interested in exploring the differences in the scores of Total Volunteering Experience according to the respondents' Total Volunteering Services Groups; and the respondents' age groups 46-55 and 56-65.
Descriptives Total Volunteering Services 95% Confidence Interval for Mean N Mean Std. Deviation Std. Error Lower Bound Upper Bound Minimum Maximum 3.00 1 2.00 2 2 4.00 2.00 2 5.00 1.00 000 000 1.00 1.00 1 6.00 1.00 8.00 3 1.33 577 333 -.10 2.77 2 10.00 2 1.00 000 000 1.00 1.00 1 11.00 1.50 .707 500 -4.85 7.85 2 12.00 1.00 000 000 1.00 1.00 13.00 2.00 1.155 577 16 3.84 14.00 1.14 378 143 79 1.49 2 15.00 1.00 000 000 1.00 1.00 16.00 2.00 2 17.00 1.14 178 143 79 1.49 18.00 1.00 000 000 1.00 1.00 1 19.00 1.00 100 000 1.00 1.00 1 20.00 6 1.00 000 000 1.00 1.00 1 21.00 1.57 .787 297 .84 2.30 3 22.00 6 1.17 408 167 74 1.60 23.00 6 1.17 408 167 74 NN 1.60 24.00 12 1.25 452 131 96 1.54 2 25.00 4 1.00 100 000 1.00 1.00 26.00 5 1.60 894 400 49 2.71 3 27.00 1.00 000 000 1.00 1.00 28.00 2 1.50 .707 500 -4.85 7.85 2 29.00 1.33 516 .211 .79 1.88 2 30.00 1.40 548 245 72 2.08 31.00 W 1.67 1.155 .667 -1.20 4.54 3 32.00 2.00 N 33.00 1.50 577 .289 58 2.42 2 34.00 2 1.50 .707 500 -4.85 7.85 2 35.00 3 1.67 577 333 23 3.10 2 36.00 1.50 .707 500 -4.85 7.85 37.00 1.00 39.00 1 1.00 1 Total 119 1.31 548 050 1.21 1.41 1 3AN OVA Total Volunteering Services Sum of Squares or Mean Square F Sig. Between Groups 9.41? 33 .285 .SEEI .581 Within Groups SHEETS 35 .30? Total 35.495 118 Group Statistics Std. Error Age Groups N Mean Std. Deviation Mean Total volunteering 46-55 29 21.9310 7.75947 1.44090 experience of the respondents. 56-65 36 22.1389 7.94680 1.32447 Total Volunteering 46-55 33 1.30 .467 081 Services 56-65 47 1.23 .476 069Independent Samples Test Levene's Test for Equality of Variances t-test for Equality of Means 95% Confidence Interval of the Mean Std. Error Difference F Sig. df Sig. (2-tailed) Difference Difference Lower Upper Total volunteering Equal variances 218 642 -.106 63 916 .20785 1.96225 -4.12910 3.71340 experience of the assumed respondents. Equal variances not -.106 60.661 916 -.20785 1.95714 -4.12184 3.70613 assumed Total Volunteering Equal variances 858 357 .643 78 522 069 107 -.145 283 Services assumed Equal variances not .645 69.889 .521 069 .107 -.144 .282 assumedIndependent Samples Effect Sizes Point 95% Confidence Interval Standardizer Estimate Lower Upper Total volunteering Cohen's d 7.86409 -.026 -.515 .463 experience of the respondents. Hedges' correction 7.95929 -.026 -.509 457 Glass's delta 7.94680 -.026 -.515 463 Total Volunteering Cohen's d .472 .146 -.300 591 Services Hedges' correction .477 .145 -.297 586 Glass's delta .476 .145 -.302 590 a. The denominator used in estimating the effect sizes. Cohen's d uses the pooled standard deviation. Hedges' correction uses the pooled standard deviation, plus a correction factor. Glass's delta uses the sample standard deviation of the control group


