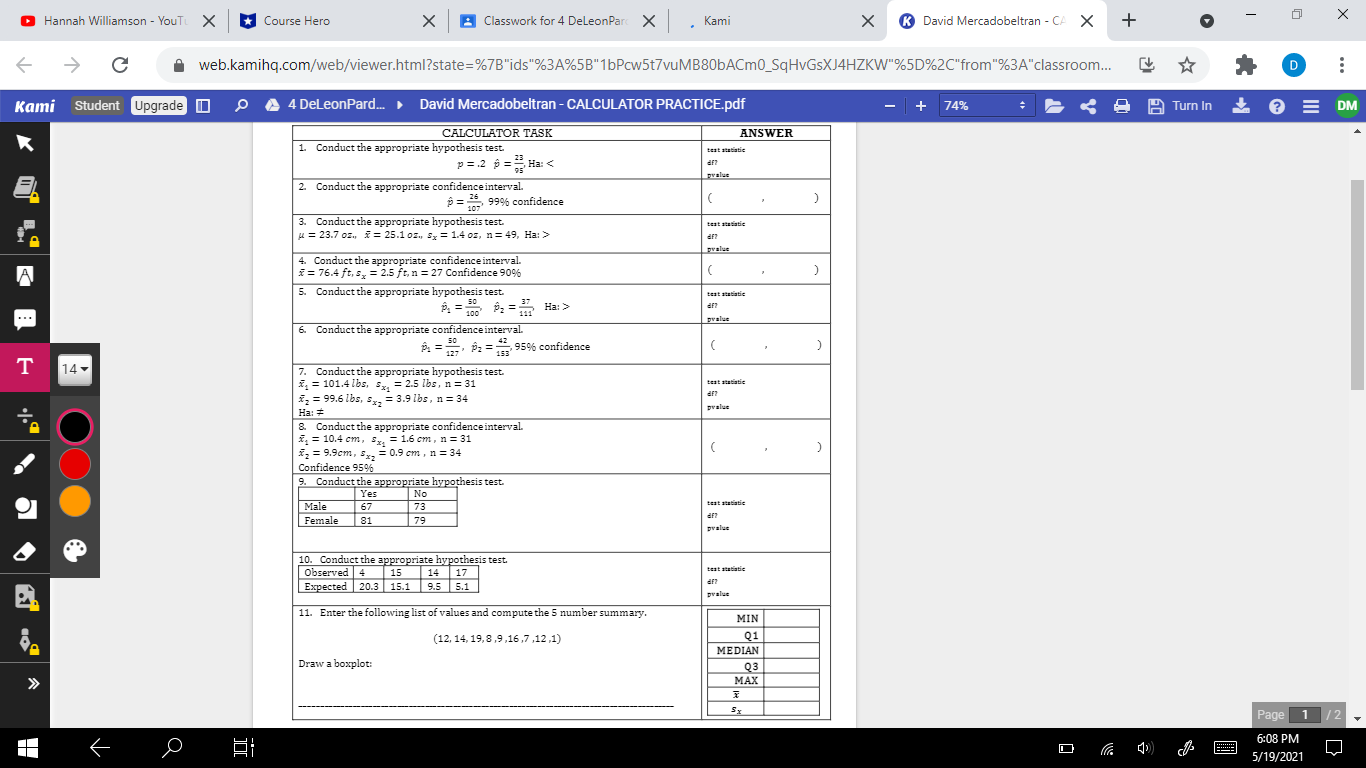
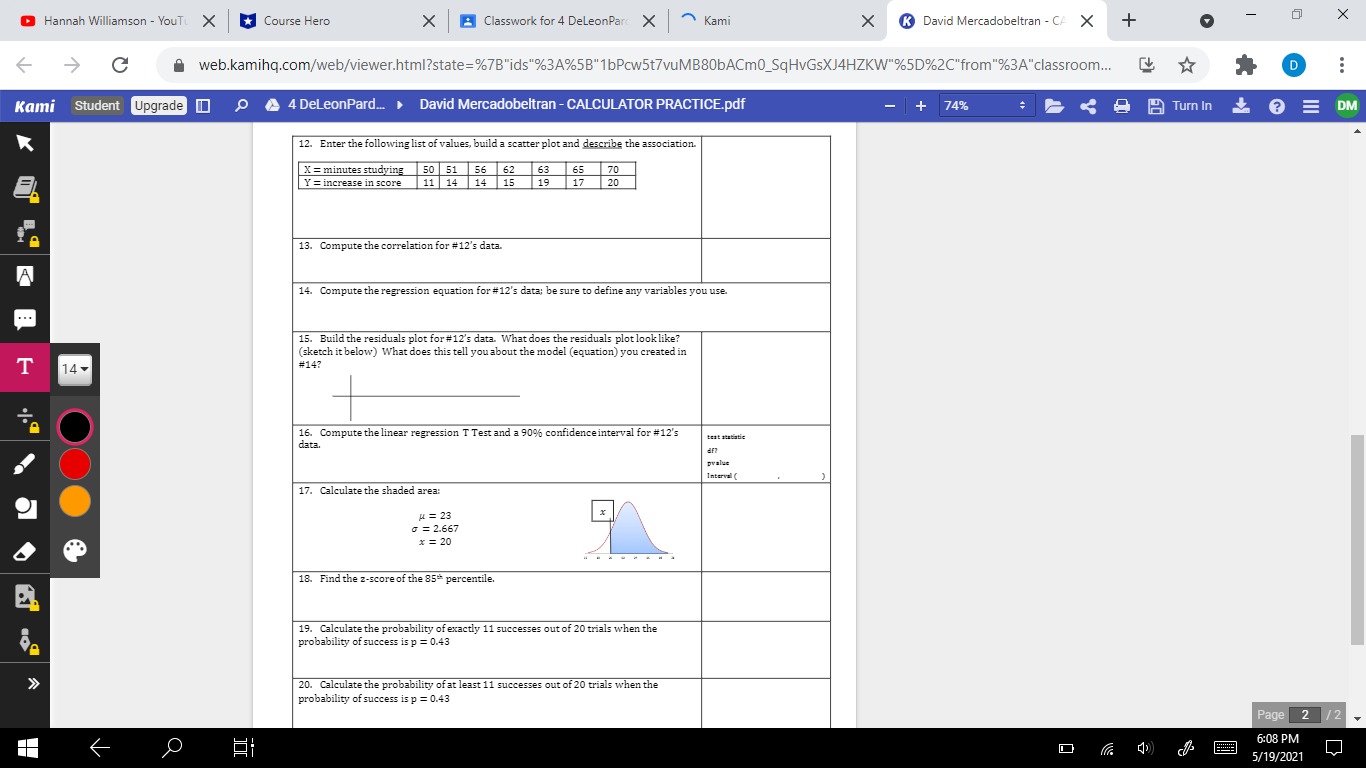
Hi what formulas are needed for these statistic problems?
Hannah Williamson - YouT X Course Hero X Classwork for 4 DeleonPart X . Kami X K David Mercadobeltran - CA X + X C web.kamihq.com/web/viewer.html?state=%7B"ids"%3A%5B"1bPcw5t7vuMB80bACm0_SqHvGsXJ4HZKW"%50%2C"from"3A"classroom... D Kami Student Upgrade ] 9 4 DeLeonPard. . David Mercadobeltran - CALCULATOR PRACTICE.pdf + 74% *6 4 8 Turn In Am ? DM CALCULATOR TASK ANSWER 1. Conduct the appropriate hypothesis test. beat statistic p = 2 p = = Ha: pvalu 4. Conduct the appropriate confidence interval = 76.4 ft, s, = 2.5 ft, n = 27 Confidence 90% 5. Conduct the appropriate hypothesis test. beat statistic Ha: > . .. pralu Conduct the appropriate confidence interval p2 = 95% confidence C 127' T 14 - 7. Conduct the appropriate hypothesis test. , = 101.4 lbs, sx, = 2.5 lbs, n = 31 beat statistic *, = 99.6 lbs, sx, = 3.9 lbs, n = 34 arz Ha: # gvalue .Conduct the appropriate confidence interval. *, = 10.4 cm, sx, = 1.6 cm , n = 31 $2 = 9.9cm, Sx, = 0.9 cm , n = 34 OOO Confidence 95% 9. Conduct the appropriate hypothesis test. Yes No Male 67 73 beat statistic Female 81 79 arz pvalue 10. Conduct the appropriate hypothesis test. Observed 4 15 14 17 test statistic Expected 20.3 15.1 9.5 5.1 praluc 11. Enter the following list of values and compute the 5 number summary MIN (12, 14, 19,8,9,16,7,12,1) Q1 MEDIAN Draw a boxplot: Q3 >> MAX SX Page 1 /2 6:08 PM 5/19/2021Hannah Williamson - YouT X Course Hero X Classwork for 4 DeleonPart X ~ Kami X K David Mercadobeltran - CA X + X C web.kamihq.com/web/viewer.html?state=%7B"ids"%3A%5B"1bPcw5t7vuMB80bACm0_SqHvGsXJ4HZKW"%50%2C"from"%3A"classroom... D Kami Student Upgrade ] 9 4 DeLeonPard. . David Mercadobeltran - CALCULATOR PRACTICE.pdf + 74% *6 4 8 Turn In Am ? DM 12. Enter the following list of values, build a scatter plot and describe the association X = minutes studying 50 51 56 62 63 65 70 FL Y = increase in score 11 14 14 15 19 17 20 13. Compute the correlation for #12's data. 14. Compute the regression equation for #12's data; be sure to define any variables you use. . .. 15. Build the residuals plot for #12's data. What does the residuals plot look like? (sketch it below) What does this tell you about the model (equation) you created in T 14 - #14? 16. Compute the linear regression T Test and a 90% confidence interval for #12's beat sentiatic data. OOO praluc Interval 17. Calculate the shaded area: A = 23 x 7 = 2.667 x = 20 18. Find the 2-score of the 85" percentile. 19. Calculate the probability of exactly 11 successes out of 20 trials when the probability of success is p = 0.43 >> 20. Calculate the probability of at least 11 successes out of 20 trials when the probability of success is p = 0.43 Page 2 /2 + 6:08 PM 5/19/2021


