History Modine was incorporated under the laws of the State of Wisconsin on June 23, 1916 by its founder, Arthur B. Modine. Mr. Modine's
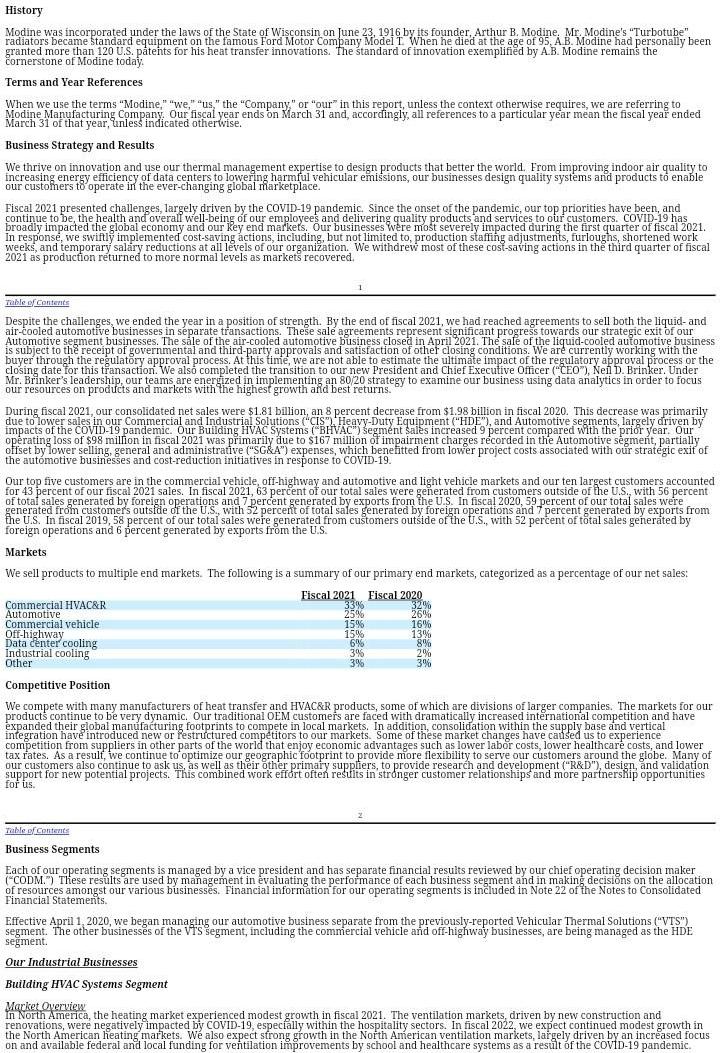
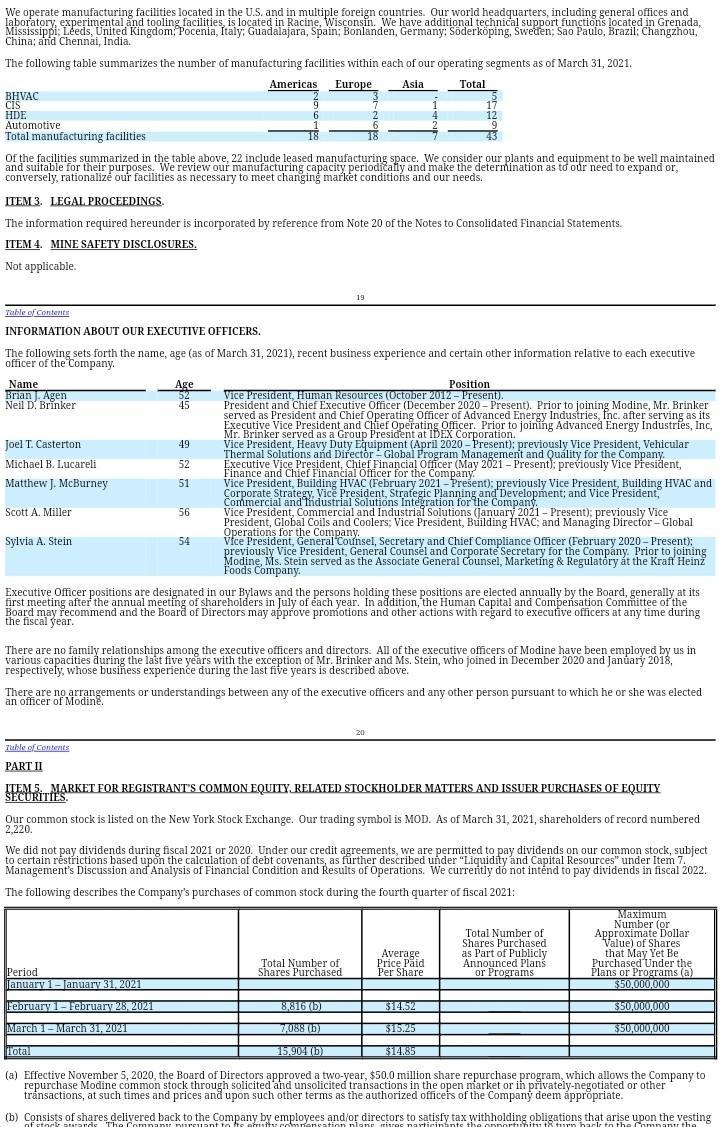
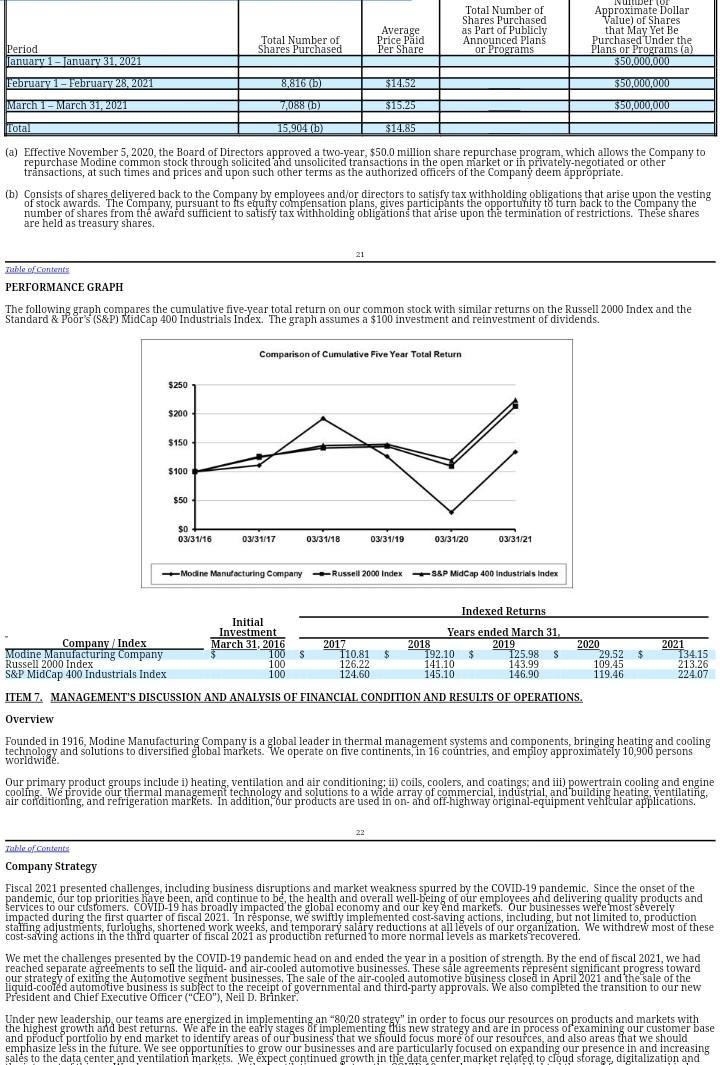
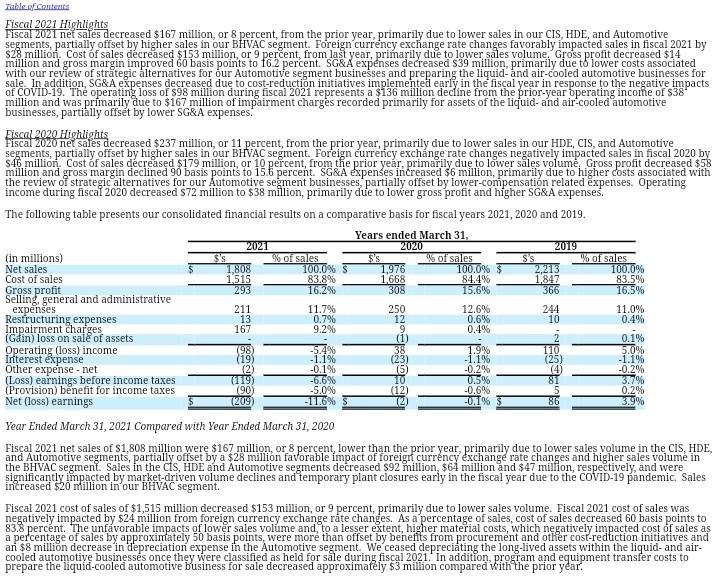
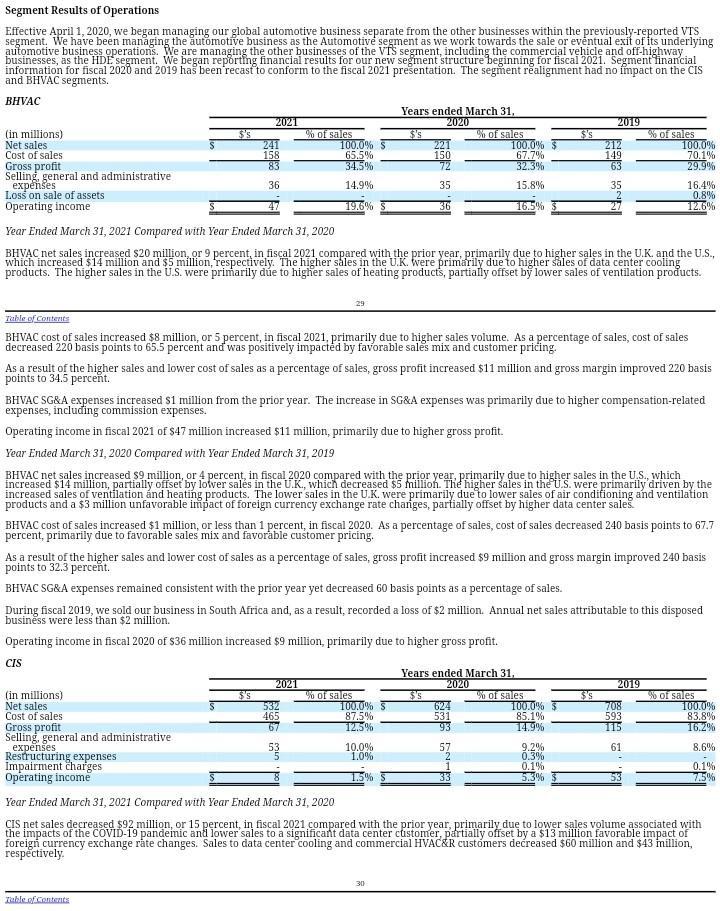
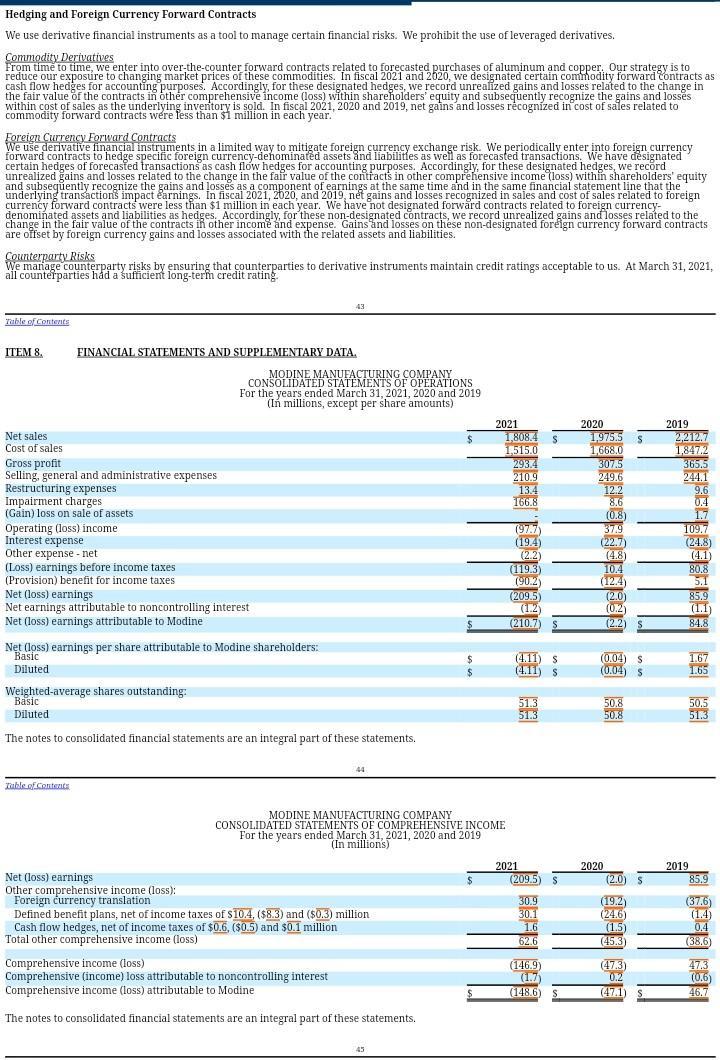
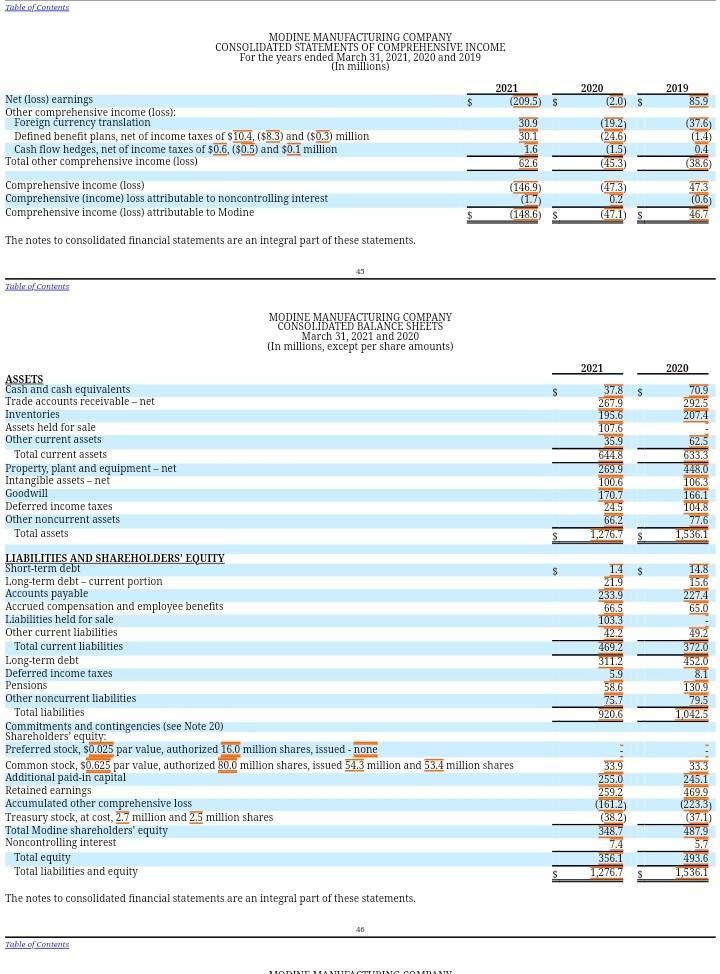
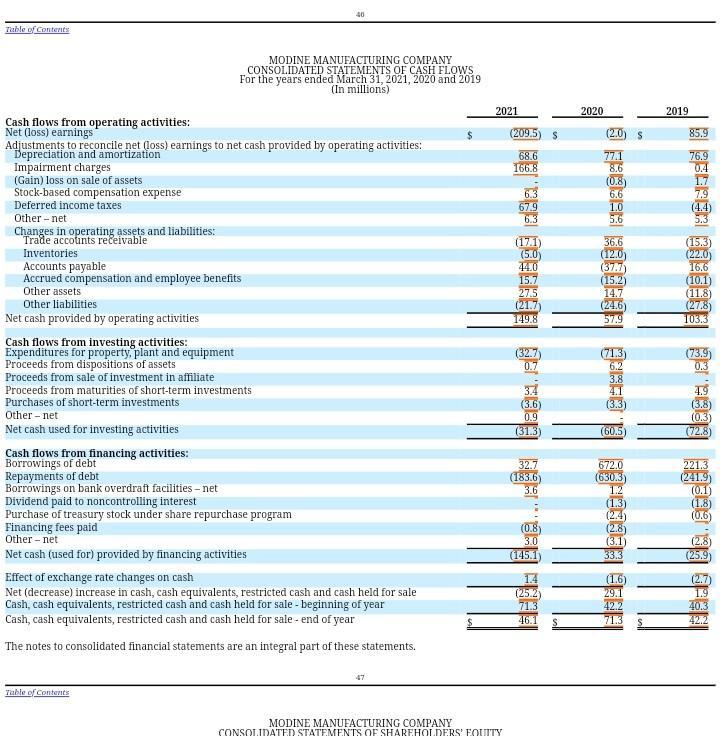
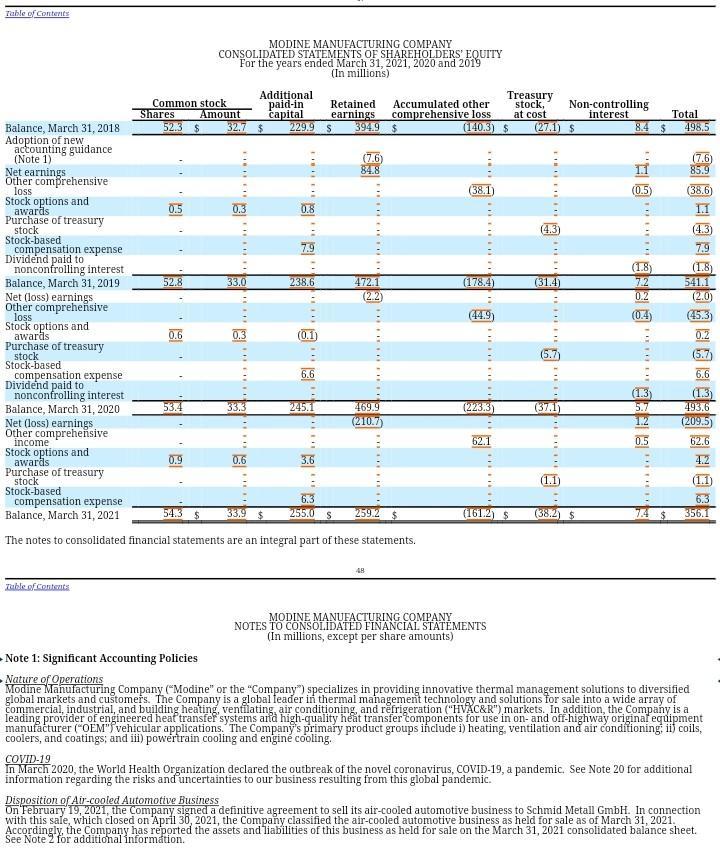
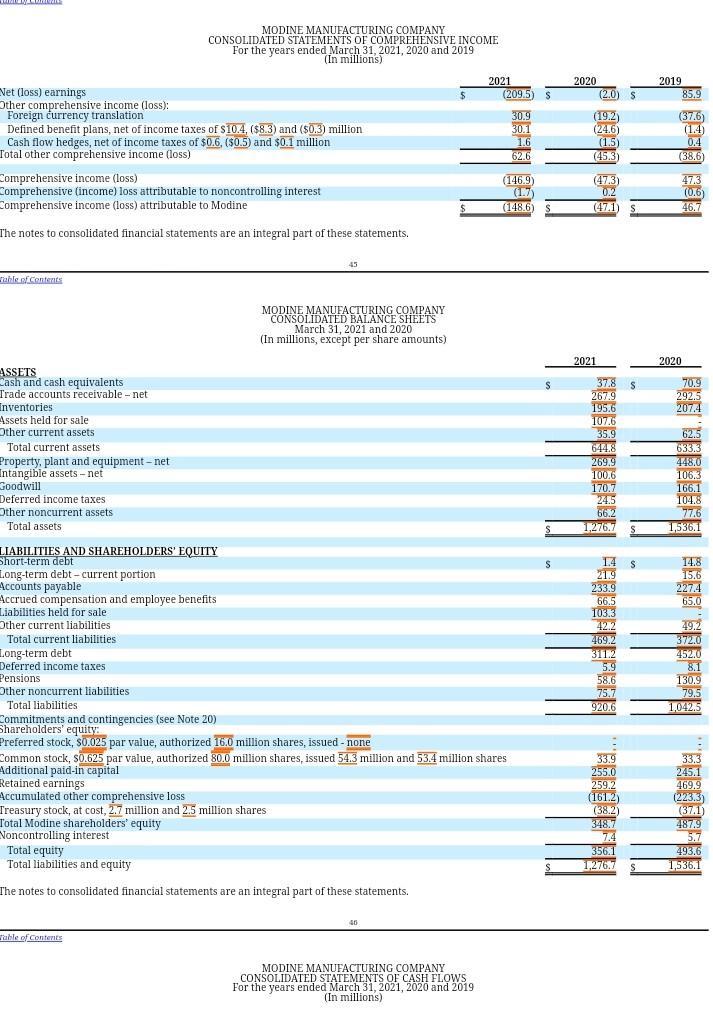
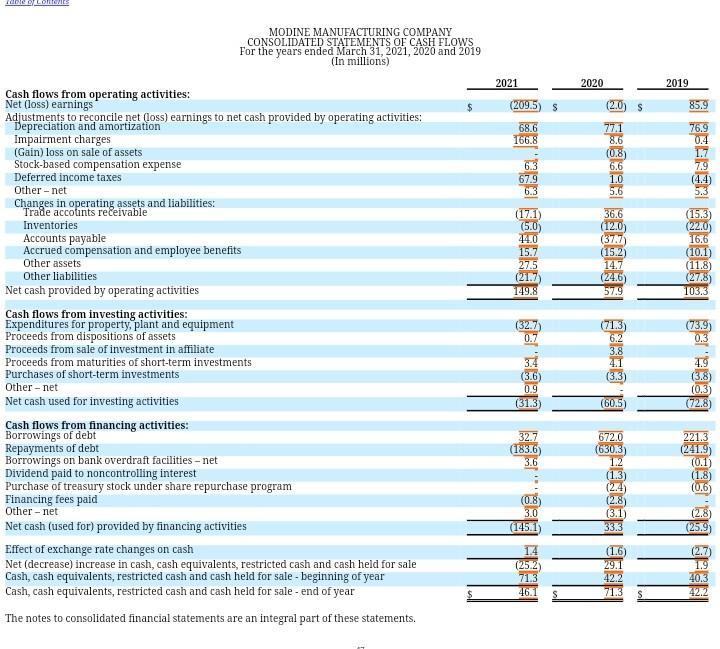
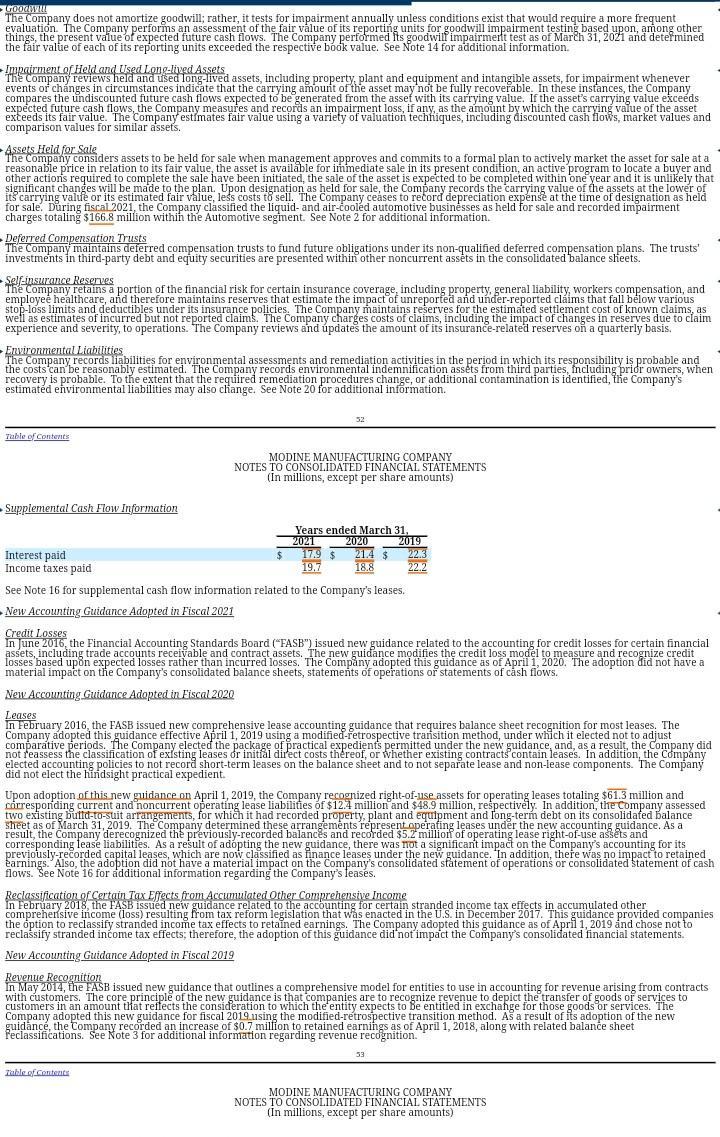
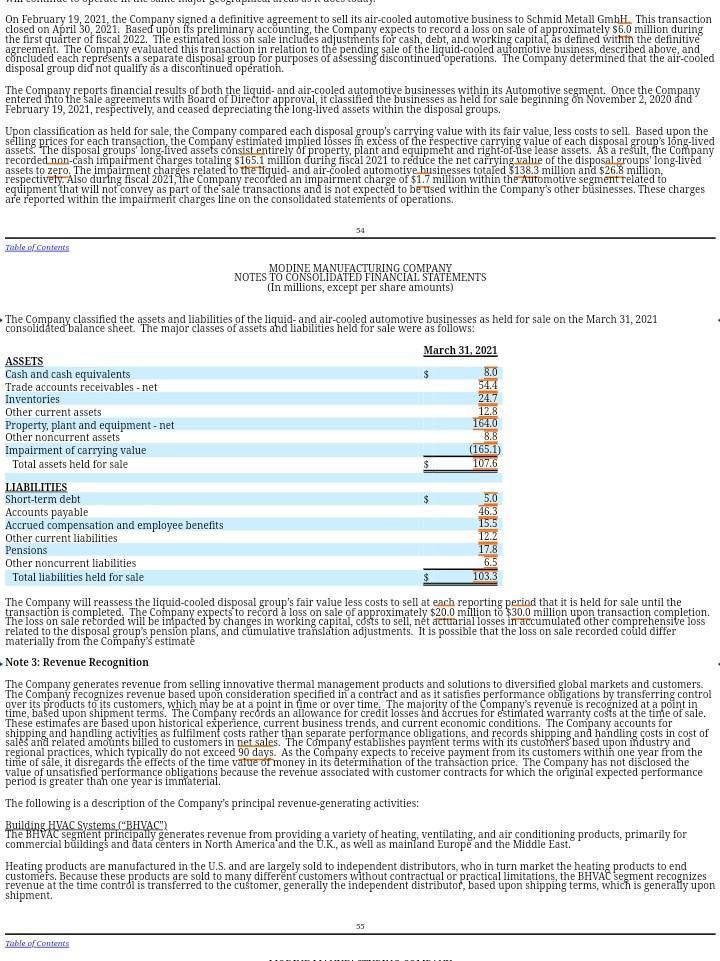
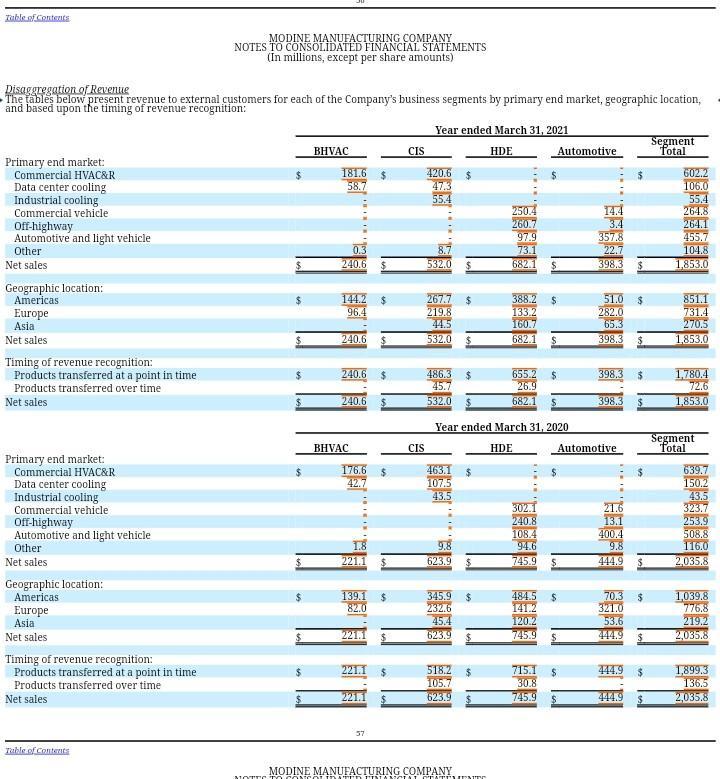
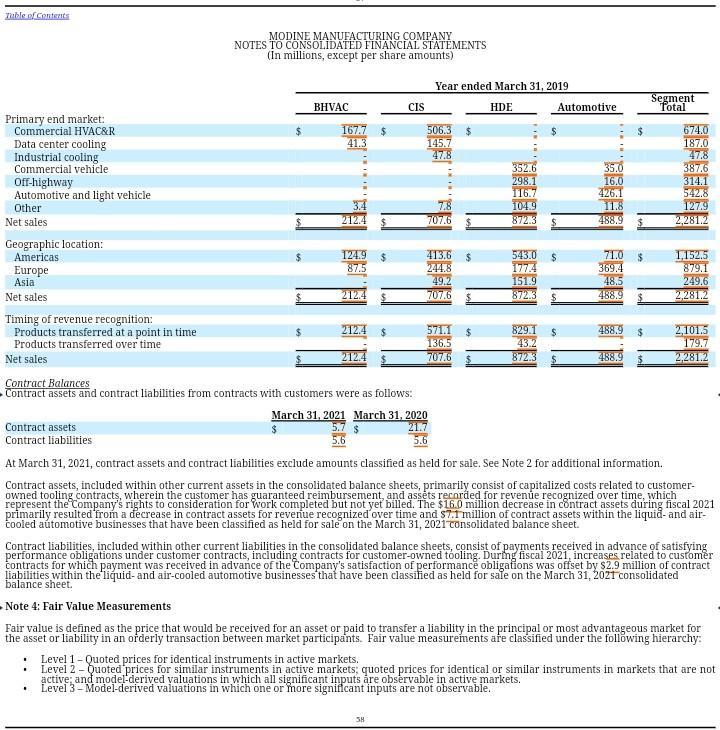
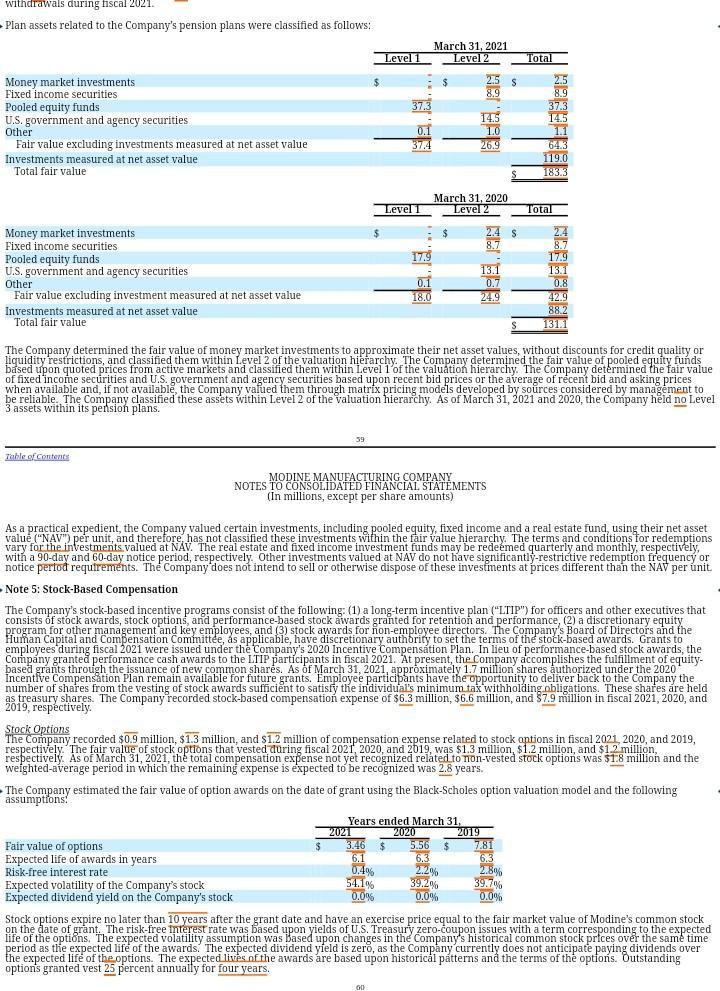
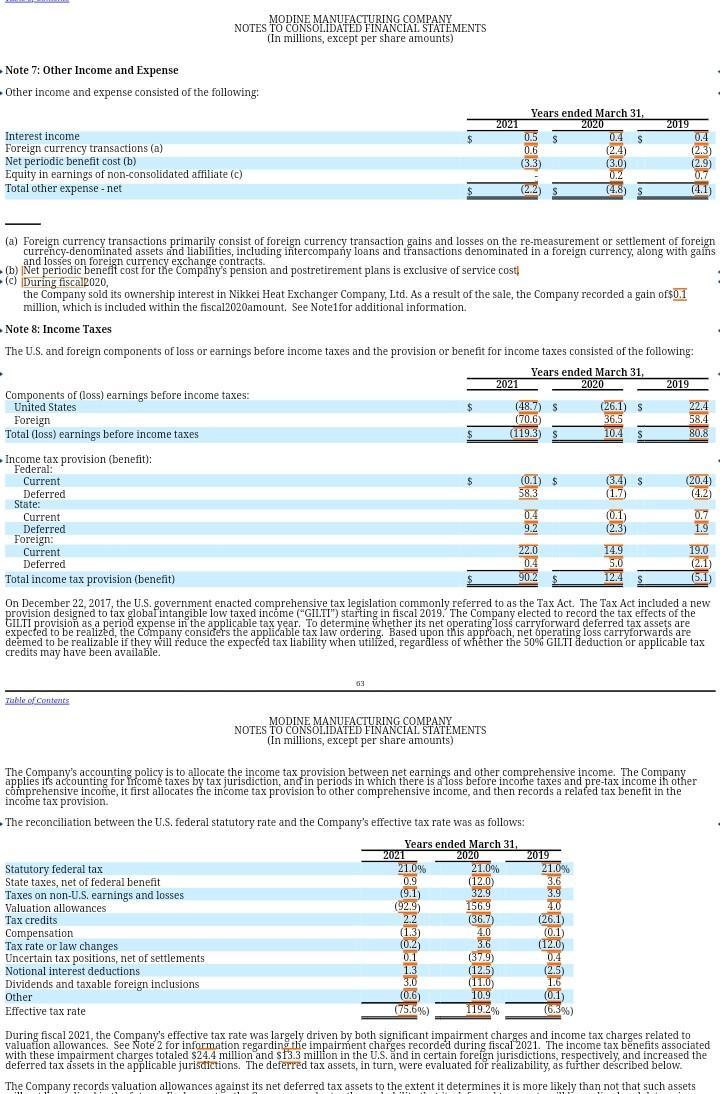
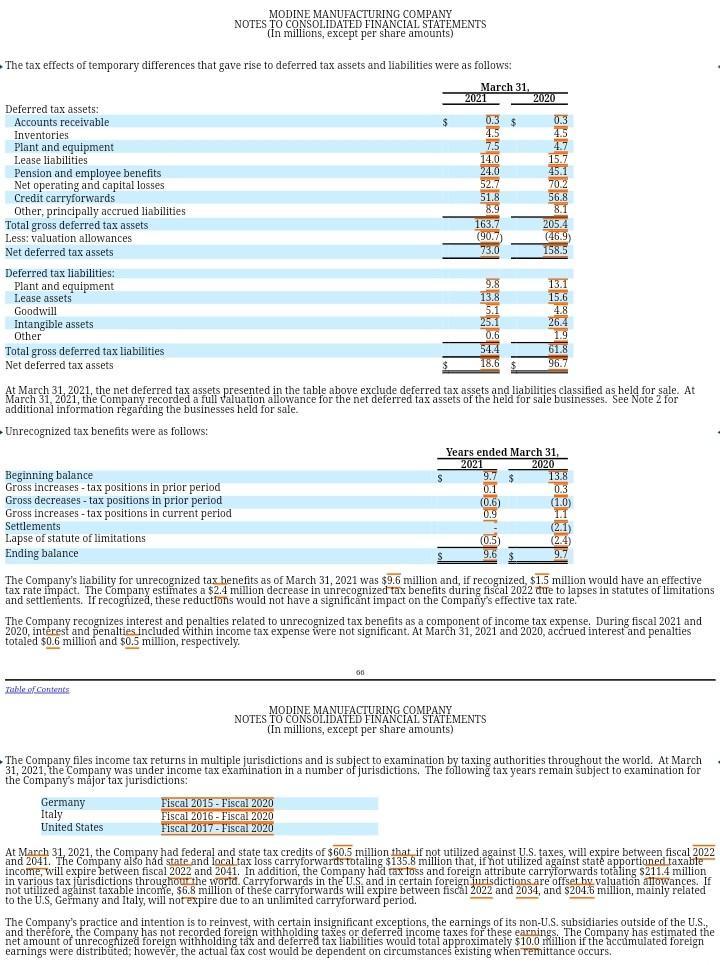
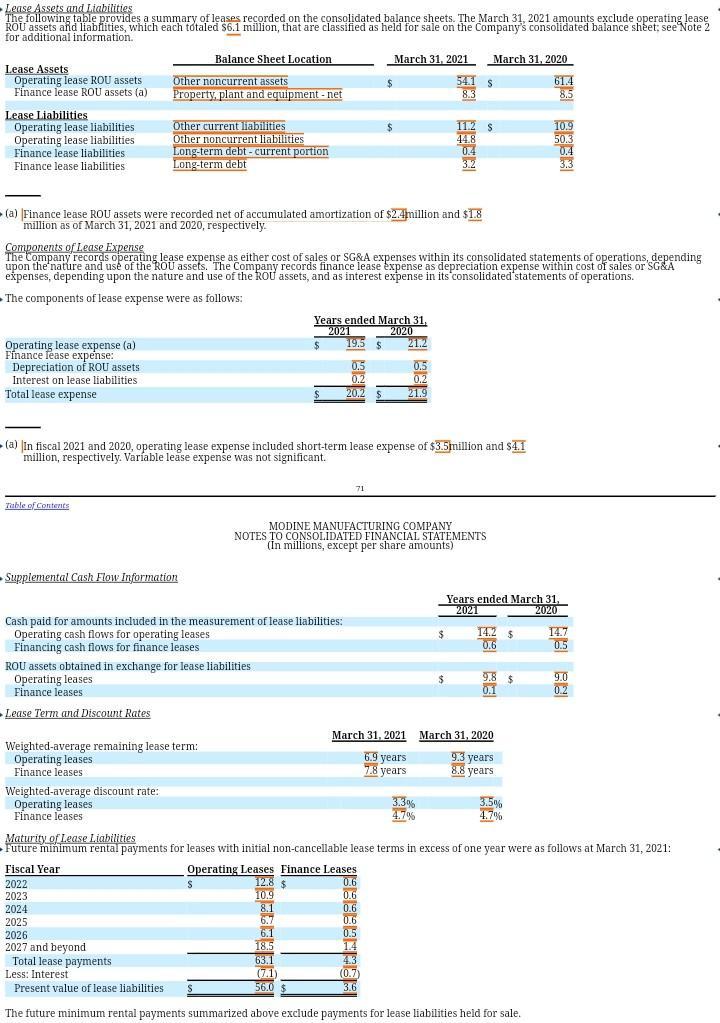
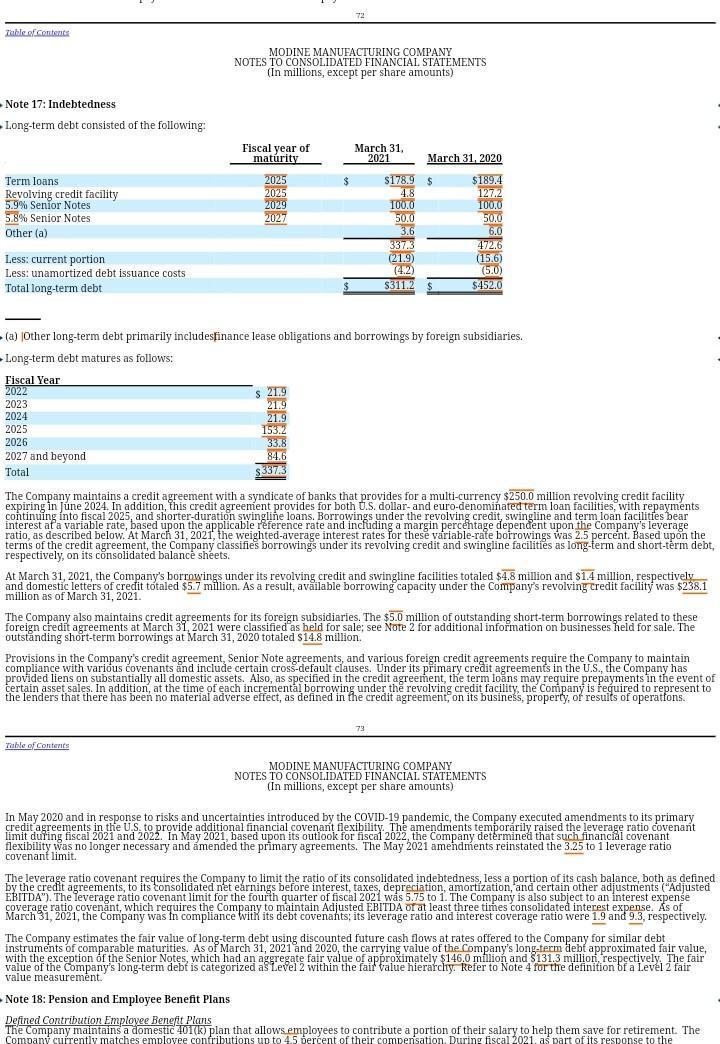
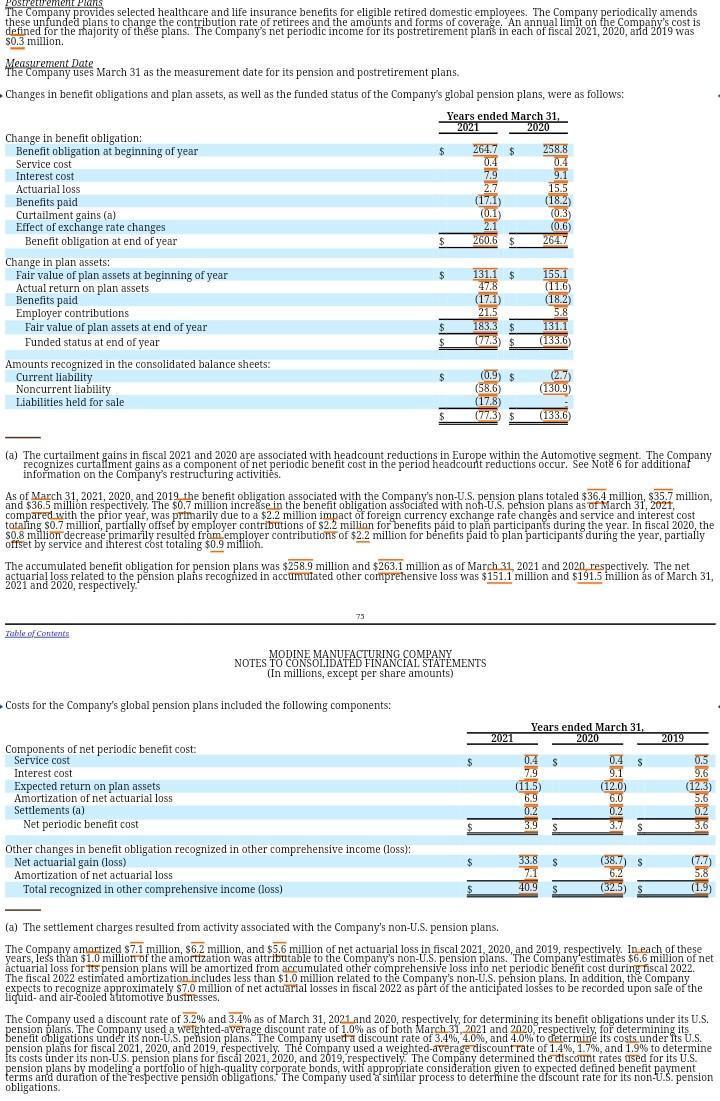
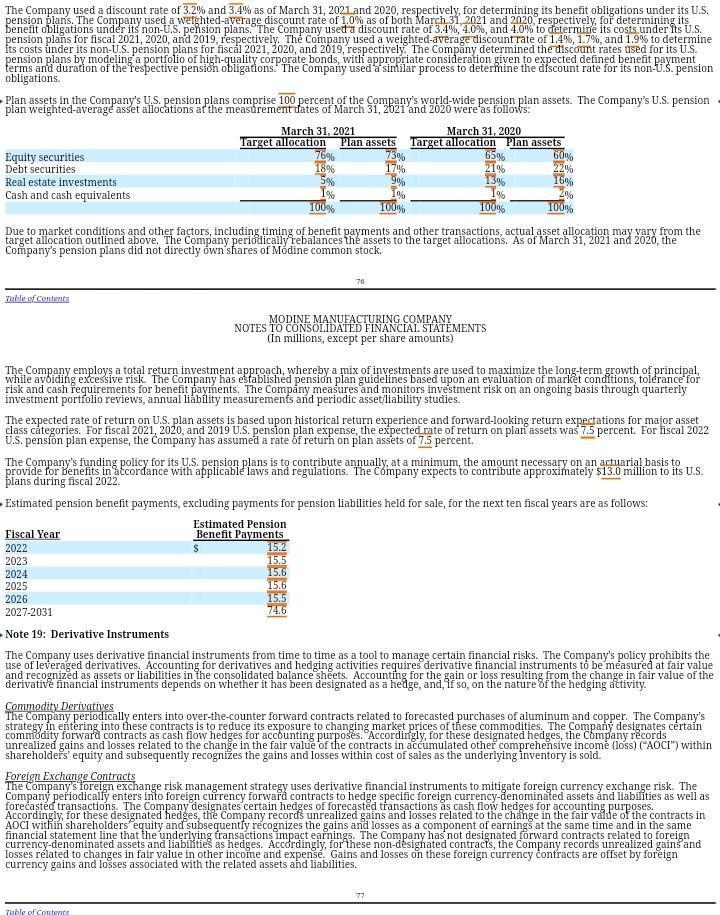
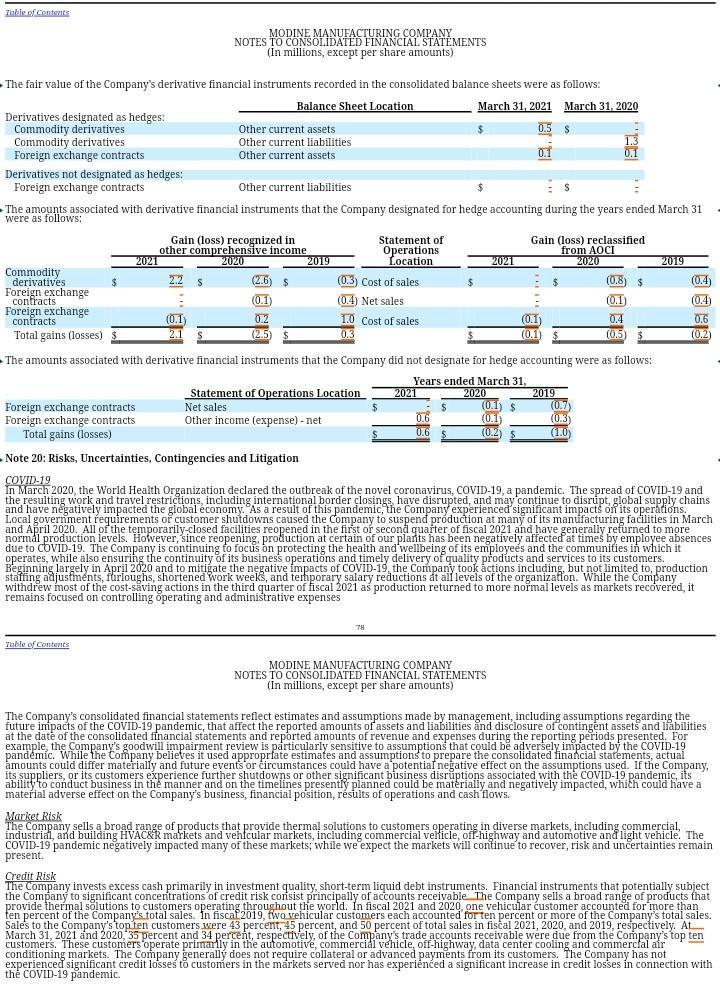
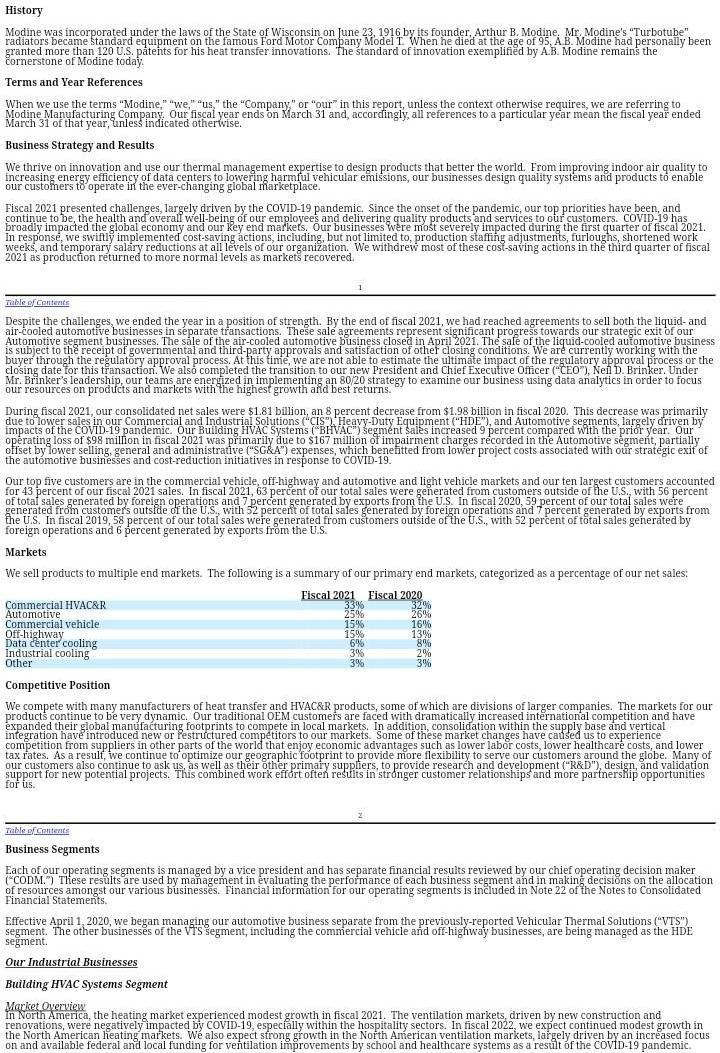

History Modine was incorporated under the laws of the State of Wisconsin on June 23, 1916 by its founder, Arthur B. Modine. Mr. Modine's "Turbotube" radiators became Standard equipment on the famous Ford Motor Company Model T. When he died at the age of 95, A.B. Modine had personally been granted more than 120 U.S. patents for his heat transfer innovations. The standard of innovation exemplified by A.B. Modine remains the cornerstone of Modine today. Terms and Year References When we use the terms "Modine," "we," "us," the "Company," or "our" in this report, unless the context otherwise requires, we are referring to Modine Manufacturing Company. Our fiscal year ends on March 31 and, accordingly, all references to a particular year mean the fiscal year ended March 31 of that year, unless indicated otherwise. Business Strategy and Results We thrive on innovation and use our thermal management expertise to design products that better the world. From improving indoor air quality to increasing energy efficiency of data centers to lowering harmful vehicular emissions, our businesses design quality systems and products to enable our customers to operate in the ever-changing global marketplace. Fiscal 2021 presented challenges, largely driven by the COVID-19 pandemic. Since the onset of the pandemic, our top priorities have been, and continue to be, the health and overall well-being of our employees and delivering quality products and services to our customers. COVID-19 has broadly impacted the global economy and our Key end markets. Our businesses were most severely impacted during the first quarter of fiscal 2021. In response, we swiftly implemented cost-saving actions, including, but not limited to, production staffing adjustments, furloughs, shortened work weeks, and temporary salary reductions at all levels of our organization. We withdrew most of these cost-saving actions in the third quarter of fiscal 2021 as production returned to more normal levels as markets recovered. 1 Table of Contents Despite the challenges, we ended the year in a position of strength. By the end of fiscal 2021, we had reached agreements to sell both the liquid- and air-cooled automotive businesses in sparate transactions. These sale agreements represent significant progress towards our strategic exit of our Automotive segment businesses. The sale of the air-cooled automotive business closed in April 2021. The sale of the liquid-cooled automotive business is subject to the receipt of governmental and third-party approvals and satisfaction of other closing conditions. We are currently working with the buyer through the regulatory approval process. At this time, we are not able to estimate the ultimate impact of the regulatory approval process or the closing date for this transaction. We also completed the transition to our new President and Chief Executive Officer ("CEO"), Neil D. Brinker. Under Mr. Brinker's leadership, our teams are energized in implementing an 80/20 strategy to examine our business using data analytics in order to focus our resources on products and markets with the highest growth and best returns. During fiscal 2021, our consolidated net sales were $1.81 billion, an 8 percent decrease from $1.98 billion in fiscal 2020. This decrease was primarily due to lower sales in our Commercial and Industrial Solutions ("CIS") Heavy-Duty Equipment ("HDE"), and Automotive segments, largely driven by impacts of the COVID-19 pandemic. Our Building HVAC Systems ("BHVAC") segment sales increased 9 percent compared with the prior year. Our operating loss of $98 million in fiscal 2021 was primarily due to $167 million of impairment charges recorded in the Automotive segment, partially offset by lower selling, general and administrative ("SG&A") expenses, which benefitted from lower project costs associated with our stratgic exit of the automotive businesses and cost-reduction initiatives in response to COVID-19. Our top five customers are in the commercial vehicle, off-highway and automotive and light vehicle markets and our ten largest customers accounted for 43 percent of our fiscal 2021 sales. In fiscal 2021, 63 percent of our total sales were generated from customers outside of the U.S., with 56 56 percent of total sales generated by foreign operations and 7 percent generated by exports from the U.S. In fiscal 2020, 59 percent of our total sales were generated from customers outside of the U.S., with 52 percent of total sales generated by foreign operations and 7 percent generated by exports from the U.S. In fiscal 2019, 58 percent of our total sales were generated from customers outside of the U.S., with 52 percent of total sales generated by foreign operations and 6 percent generated by exports from the U.S. Markets We sell products to multiple end markets. The following is a summary of our primary end markets, categorized as a percentage of our net sales: Fiscal 2021 Fiscal 2020 33% 32% 25% 26% Commercial HVAC&R Automotive Commercial vehicle Off-highway Data center cooling Industrial cooling Other 15% 15% 6% 3% 3% 16% 13% 8% 2% 3% Competitive Position We compete with many manufacturers of heat transfer and HVAC&R products, some of which are divisions of larger companies. The markets for our products continue to be very dynamic. Our traditional OEM customers are faced with dramatically increased international competition and have expanded their global manufacturing footprints to compete in local markets. In addition, consolidation within the supply base and vertical integration have introduced new or festructured comptitors to our markets. Some of these market changes have caused us to experience competition from suppliers in other parts of the world that enjoy economic advantages such as lower labor costs, lower healthcare costs, and lower tax rates. As a result, we continue to optimize our geographic footprint to provide more flexibility to serve our customers around the globe. Many of our customers also continue to ask us, as well as their other primary suppliers, to provide research and development ("R&D"), design, and validation support for new potential projects. This combined work effort often results in stronger customer relationships and more partnership opportunities for us. Table of Contents Business Segments Each of our operating segments is managed by a vice president and has separate financial results reviewed by our chief operating decision maker ("CODM.") These results are used by management in evaluating the performance of each business segment and in making decisions on the allocation of resources amongst our various businesses. Financial information for our operating segments is included in Note 22 of the Notes to Consolidated Financial Statements. Effective April 1, 2020, we began managing our automotive business separate from the previously-reported Vehicular Thermal Solutions ("VTS") segment. The other businesses of the VTS segment, including the commercial vehicle and off-highway businesses, are being managed as the HDE segment. Our Industrial Businesses Building HVAC Systems Segment Market Overview In North America, the heating market experienced modest growth in fiscal 2021. The ventilation markets, driven by new construction and renovations, were negatively impacted by COVID-19, especially within the hospitality sectors. In fiscal 2022, we expect continued modest growth in the North American heating markets. We also expect strong growth in the North American ventilation markets, largely driven by an increased focus on and available federal and local funding for ventilation improvements by school and healthcare systems as a result of the COVID-19 pandemic. We operate manufacturing facilities located in the U.S. and in multiple foreign countries. Our world headquarters, including general offices and laboratory, experimental and tooling facilities, is located in Racine, Wisconsin. We have additional technical support functions located in Grenada, Mississippi; Leeds, United Kingdom, Pocenia, Italy: Guadalajara, Spain; Bonlanden, Germany; Sderkping, Sweden; Sao Paulo, Brazil; Changzhou, China; and Chennai, India. The following table summarizes the number of manufacturing facilities within each of our operating segments as of March 31, 2021. Americas Europe Asia Total BHVAC CIS HDE Automotive Total manufacturing facilities of the facilities summarized in the table above, 22 include leased manufacturing space. We consider our plants and equipment to be well maintained and suitable for their purposes. We review our manufacturing capacity periodically and make the determination as to our need to expand or, conversely, rationaliz our facilities as necessary to meet changing market conditions and our needs. ITEM 3. LEGAL PROCEEDINGS. The information required hereunder is incorporated by reference from Note 20 of the Notes to Consolidated Financial Statements. ITEM 4. MINE SAFETY DISCLOSURES. Not applicable. Table of Contents INFORMATION ABOUT OUR EXECUTIVE OFFICERS. The following sets forth the name, age (as of March 31, 2021), recent business experience and certain other information relative to each executive officer of the Company. Name Brian J. Agen Neil D. Brinker Joel T. Casterton Michael B. Lucareli Matthew J. McBurney Scott A. Miller Sylvia A. Stein Age 52 45 49 52 51 Table of Contents PART II 56 54 19 Position Vice President, Human Resources (October 2012 - Present). President and Chief Executive Officer (December 2020 - Present). Prior to joining Modine, Mr. Brinker served as President and Chief Operating Officer of Advanced Energy Industries, Inc. after serving as its Executive Vice President and Chief Operating Officer. Prior to joining Advanced Energy Industries, Inc, Mr. Brinker served as a Group President at IDEX Corporation. Vice President, Heavy Duty Equipment (April 2020-Present); previously Vice President, Vehicular Thermal Solutions and Director - Global Program Management and Quality for the Company. Executive Vice President, Chief Financial Officer (May 2021 - Present): previously Vice President, Finance and Chief Financial Officer for the Company. Vice President, Building HVAC (February 2021-Present); previously Vice President, Building HVAC and Corporate Strategy, Vice President, Strategic Planning and Development; and Vice President, Commercial and Industrial Solutions Integration for the Company. Vice President, Commercial and Industrial Solutions (January 2021- Present); previously Vice President, Global Coils and Coolers; Vice President, Building HVAC; and Managing Director - Global the Executive Officer positions are designated in our Bylaws and the persons holding these positions are elected annually by the Board, generally at its first meeting after the annual meeting of shareholders in July of each year. In addition, the Human Capital and Compensation Committee of the Board may recommend and the Board of Directors may approve promotions and other actions with regard to executive officers at any time during the fiscal year. Period January 1- January 31, 2021 February 1-February 28, 2021 March 1-March 31, 2021 Total Vice President, General Counsel, Secretary and Chief Compliance Officer (February 2020 - Present); previously Vice President, General Counsel and Corporate Secretary for the Company. Prior to joining Modine, Ms. Stein served as the Associate General Counsel, Marketing & Regulatory at the Kraft Heinz Foods Company. There are no family relationships among the executive officers and directors. All of the executive officers of Modine have been employed by us in various capacities during the last five years with the exception of Mr. Brinker and Ms. Stein, who joined in December 2020 and January 2018, respectively, whose business experience during the last five years is described above. There are no arrangements or understandings between any of the executive officers and any other person pursuant to which he or she was elected an officer of Modine. ITEM 5. MARKET FOR REGISTRANT'S COMMON EQUITY. RELATED STOCKHOLDER MATTERS AND ISSUER PURCHASES OF EQUITY SECURITIES. Our common stock is listed on the New York Stock Exchange. Our trading symbol is MOD. As of March 31, 2021, shareholders of record numbered 2,220. We did not pay dividends during fiscal 2021 or 2020. Under our credit agreements, we are permitted to pay dividends on our common stock, ject to certain restrictions based upon the calculation of debt covenants, as further described under "Liquidity and Capital Resources" under Item 7. Management's Discussion and Analysis of Financial Condition and Results of Operations. We currently do not intend to pay dividends in fiscal 2022. The following describes the Company's purchases of common stock during the fourth quarter of fiscal 2021: Total Number of Shares Purchased 8,816 (b) 7,088 (b) 15.904 (b) Average. Price Paid Per Share $14.52 $15.25 $14.85 Total Number of Shares Purchased as part of Publicly Announced Plans. or Programs Maximum Number (or Approximate Dollar Value) of Shares that May Yet Be. Purchased Under the Plans or Programs (a) $50,000,000 $50,000,000 $50,000.000 (a) Effective November 5, 2020, the Board of Directors approved a two-year, $50.0 million share repurchase program, which allows the Company to repurchase Modine common stock through solicited and unsolicited transactions in the open market or in privately-negotiated or other transactions, at such times and prices and upon such other terms as the authorized officers of the Company deem ppropriate. (b) Consists of shares delivered back to the Company by employees and/or directors to satisfy tax withholding obligations that arise upon the vesting Period January 1-January 31, 2021 February 1-February 28, 2021 March 1-March 31, 2021 Total Table of Contents PERFORMANCE GRAPH 8,816 (5) 7,088 (b) 15.904 (b) (a) Effective November 5, 2020, the Board of Directors approved a two-year, $50.0 million share repurchase program, which allows the Company to repurchase Modine common stock through solicited and unsolicited transactions in the open market or in privately-negotiated or other transactions, at such times and prices and upon such other terms as the authorized officers of the Company deem ppropriate. $250 (b) Consists of shares delivered back to the Company by employees and/or directors to satisfy tax withholding obligations that arise upon the vesting of stock awards. The Company, pursuant to its equity compensation plans, gives participants the opportunity to turn back to the Company the number of shares from the award sufficient to satisfy tax withholding obligations that arise upon the termination of restrictions. These shares are held as treasury shares. $200 $150 Table of Contents Company Strategy Total Number of Shares Purchased $100 The following graph compares the cumulative five-year total return on our common stock with similar returns on the Russell 2000 Index and the Standard & Poor's (S&P) MidCap 400 Industrials Index. The graph assumes a $100 investment and reinvestment of dividends. $50 $0 03/31/16 03/31/17 Initial Investment March 31, 2016 Average Price Paid Per Share 21 Comparison of Cumulative Five Year Total Return. 03/31/18 100 S 100 100 $14.52 $15.25 $14.85 2017 Total Number of Shares Purchased as Part of Publicly Announced Plans or Programs 03/31/19 Modine Manufacturing Company Russell 2000 Index S&P MidCap 400 Industrials Index Company/Index Modine Manufacturing Company Russell 2000 Index S&P MidCap 400 Industrials Index ITEM 7. MANAGEMENT'S DISCUSSION AND ANALYSIS OF FINANCIAL CONDITION AND RESULTS OF OPERATIONS. T10.81 $ 126.22 124.60 22 03/31/20 2018 03/31/21 Indexed Returns Years ended March 31, 2019 Approximate Dollar Value) of Shares that May Yet Be Purchased Under the Plans or Programs (a) $50,000,000 $50,000,000 $50,000,000 192.10 $ 141.10 145.10 125.98 S 143.99 146.90 2020 29.52 $ 109.45 119.46 Overview Founded in 1916, Modine Manufacturing Company is a global leader in thermal management systems and components, bringing heating and cooling technology and solutions to diversified global markets. We operate on five continents, in 16 countries, and employ approximately 10,900 persons worldwide. 2021 134.15 213.26 224.07 Our primary product groups include i) heating, ventilation and air conditioning; ii) coils, coolers, and coatings; and iii) powertrain cooling and engine cooling We provide our thermal management technology and solutions to a wide array of commercial, industrial, and building heating, ventilating, air conditioning, and refrigeration markets. In addition, our products are used in on- and off-highway original-equipment vehicular applications. Fiscal 2021 presented challenges, including business disruptions and market weakness spurred by the COVID-19 pandemic. Since the onset of the pandemic, our top priorities have been, and continue to be, the health and overall well-being of our employees and delivering quality products and Services to our customers. COVID-19 has broadly impacted the global economy and our key end markets. Our businesses were most severely impacted during the first quarter of fiscal 2021. In rsponse, we swiftly implemented cost-saving actions, including, but not limited to, production furloughs, shortened work weeks, and temporar salry reductions at all levels of our organization. We withdrew most of these cost-saving actions in the third quarter of fiscal 2021 as production returned to more normal levels as markets recovered. We met the challenges presented by the COVID-19 pandemic head on and ended the year in a position of strength. By the end of fiscal 2021, we had reached separate agreements to sell the liquid- and air-cooled automotive businesses. These sle agreements represent significant progress toward our strategy of exiting the Automotive segment businesses. The sale of the air-cooled automotive business closed in April 2021 and the sale of the liquid-cooled automotive business is subject to the receipt of governmental and third-party approvals. We also completed the transition to our new President and Chief Executive Officer ("CEO"), Neil D. Brinker. Under new leadership, our teams are energized in implementing an "80/20 strategy" in order to focus our resources on products and markets with the highest growth and best returns. We are in the early stages of implementing this new strategy and are in process of examining our customer base and product portfolio by end market to identify areas of our business that we should focus more of our resources, and also areas that we should emphasize less in the future. We see opportunities to grow our businesses and are particularly focused on expanding our presence. ice in and increasing sales to the data center and ventilation markets. We expect continued growth in the data cenfer market related to cloud storage, digitalization and Table of Contents Fiscal 2021 Highlights Fiscal 2021 net sales decreased $167 million, or 8 percent, from the prior year, primarily due to lower sales in our CIS, HDE, and Automotive segments, partially offset by higher sales in our BHVAC segment. Foreign currency exchange rate changes favorably impacted sales in fiscal 2021 by $28 million. Cost of sales dcreased $153 million, or 9 percent, from last year, primarily due to lower sales volume, Gross profit decreased $14 million and gross margin improved 60 basis points to 16.2 percent. SG&A expenses decreased $39 million, primarily due to lower costs associated with our review of strategic alternatives for our Automotive segment businesses and preparing the liquid- and air-cooled automotive businesses for sale. In addition, SG&A expenses decreased due to cost-reduction initiatives implemented early in the fiscal year in response to the negative impacts. of COVID-19. The operating loss of $98 million during fiscal 2021 represents a $136 million decline from the prior-year operating income of $38 million and was primarily due to $167 million of impairment charges recorded primarily for assets of the liquid- and air-cooled automotive businesses, partially offset by lower SG&A expenses. Fiscal 2020 Highlights Fiscal 2020 net sales decreased $237 million, or 11 percent, from the prior year, primarily due to lower sales in our HDE, CIS, and Automotive segments, partially offset by higher sales in our BHVAC segment. Foreign currency exchange rate changes negatively impacted sales in fiscal 2020 by $46 million. Cost of sales decreased $179 million, or 10 percent, from the prior year, primarily due to lower sales volume. Gross profit decreased $58 million and gross margin declined 90 basis points to 15.6 percent. SG&A expenses increased $6 million, primarily due to higher costs associated with the review of strategic alternatives for our Automotive segment businesses, partially offset by lower-compensation related expenses. Operating income during fiscal 2020 decreased $72 million to $38 million, primarily due to lower gross profit and higher SG&A expenses. The following table presents our consolidated financial results on a comparative basis for fiscal years 2021, 2020 and 2019. Years ended March 31, 2020 (in millions) Net sales Cost of sales Gross profit Selling, general and administrative expenses Restructuring expenses Impairment charges (Gain) loss on sale of assets Operating (loss) income Interest expense Other expense net (Loss) earnings before income taxes (Provision) benefit for income taxes Net (loss) earnings $'s 2021 1.808 1,515 293 211 13 167 (98) (19) (2) (119) (90) (209) % of sales 100.0 % S 83.8% 16.2% 11.7% 0.7% 9.2% -5.4% -1.1% -0.1% -6.6% -5.0% -11.69 $'s 1,976 1,668 308 250 12 9 (1) (23) % of sales 100.0% 84.4% 15.6% 12.6% 0.6% 0.4% 1.9% -1.1% -0.2% 0.5% -0.6% -0.1% S's 2019 2,213 1,847 366 244 10 110 (25) (4) 81 86 % of sales 100.0% 83.5% 16.5% 11.0% 0.4% 0.1% 5.0% -1.1% -0.2% 3.7% 0.2% 3.9% Year Ended March 31, 2021 Compared with Year Ended March 31, 2020 Fiscal 2021 net sales of $1,808 million were $167 million, or 8 percent, lower than the prior year, primarily due to lower sales volume in the CIS, HDE, and Automotive segments, partially offset by a $28 million favorable impact of foreign currency exchange rate changes and higher sales volume in the BHVAC segment. Sales in the CIS, HDE and Automotive segments decreased $92 million, $64 million and $47 million, respectively, and were significantly impacted by market-driven volume declines and temporary plant closures early in the fiscal year due to the COVID-19 pandemic. Sales increased $20 million in our BHVAC segment. Fiscal 2021 cost of sales of $1,515 million decreased $153 million, or 9 percent, primarily due to lower sales volume. Fiscal 2021 cost of sales was negatively impacted by $24 million from foreign currency exchange rate changes. As a percentage of sales, cost of sales decreased 60 basis points to 83.8 percent. The unfavorable impacts of lower sales volume and, to a lesser extent, higher material costs, which negatively impacted cost of sales as a percentage of sales by approximately 50 basis points, were more than offset by benefits from procurement and other cost-reduction initiatives and an $8 million decrease in depreciation expense in the Automotive segment. We ceased depreciating the long-lived assets within the liquid- and air- cooled automotive businesses once they were classified as held for sale during fiscal 2021. In addition, program and equipment transfer costs to prepare the liquid-cooled automotive business for sale decreased approximately $3 million compared with the prior year. Segment Results of Operations Effective April 1, 2020, we began managing our global automotive business separate from the other businesses within the previously-reported VTS segment. We have been managing the automotive business as the Automotive segment as we work towards the sale or eventual exit of its underlying automotive business operations. We are managing the other businesses of the VTS segment, including the commercial vehicle and off-highway businesses, as the HDE segment. We began reporting financial results for our new segment structure beginning for fiscal 2021. Segment financial information for fiscal 2020 and 2019 has been recast to conform to the fiscal 2021 presentation. The segment realignment had no impact on the CIS and BHVAC segments. BHVAC (in millions) Net sales Cost of sales Gross profit Selling, general and administrative expenses Loss on sale of assets Operating income 2021 241 158 83 36 (in millions) Net sales Cost of sales Gross profit Selling, general and administrative % of sales expenses Restructuring expenses Impairment charges Operating income 100.0% 65.5% 34.5% 14.9% 19.6% S $'s Table of Contents 29 Year Ended March 31, 2021 Compared with Year Ended March 31, 2020 BHVAC net sales increased $20 million, or 9 percent, in fiscal 2021 compared with the prior year, primarily due to higher sales in the U.K. and the U.S., which increased $14 million and $5 million, respectively. The higher sales in the U.K. were primarily due to higher sales of data center cooling products. The higher sales in the U.S. were primarily due to higher sales of heating products, partially offset by lower sales of ventilation products. 2021 Years ended March 31, 2020 Table of Contents BHVAC cost of sales increased $8 million, or 5 percent, in fiscal 2021, primarily due to higher sales volume. As a percentage of sales, cost of sales decreased 220 basis points to 65.5 percent and was positively impacted by favorable sales mix and customer pricing. 532 465 67 53 221 150 72 35 As a result of the higher sales and lower cost of sales as a percentage of sales, gross profit increased $11 million and gross margin improved 220 basis points to 34.5 percent. BHVAC SG&A expenses increased $1 million from the prior year. The increase in SG&A expenses was primarily due to higher compensation-related expenses, including commission expenses. Operating income in fiscal 2021 of $47 million increased $11 million, primarily due to higher gross profit. Year Ended March 31, 2020 Compared with Year Ended March 31, 2019 % of sales BHVAC net sales increased $9 million, or 4 percent, in fiscal 2020 compared with the prior year, primarily due to higher sales in the U.S., which increased $14 million, partially offset by lower sales in the U.K., which decreased $5 million. The higher sales in the U.S. were primarily driven by the increased sales of ventilation and heating products. The lower sales in the U.K. were primarily due to lower sales of air conditioning and ventilation products and a $3 million unfavorable impact of foreign currency exchange rate changes, partially offset by higher data center sales. % of sales 100.0% 67.7% 32.3% 15.8% 16.5% BHVAC cost of sales increased $1 million, or less than 1 percent, in fiscal 2020. As a percentage of sales, cost of sales decreased 240 basis points to 67.7 percent, primarily due to favorable sales mix and favorable customer pricing. As a result of the higher sales and lower cost of sales as a percentage of sales, gross profit increased $9 million and gross margin improved 240 basis points to 32.3 percent. BHVAC SG&A expenses remained consistent with the prior year yet decreased 60 basis points as a percentage of sales. 100.0% S 87.5% 12.5% During fiscal 2019, we sold our business in South Africa and, as a result, recorded a loss of $2 million. Annual net sales attributable to this disposed business were less than $2 million. Operating income in fiscal 2020 of $36 million increased $9 million, primarily due to higher gross profit. CIS 10.0% 1.0% % 30 2019 212 149 63 35 624 531 93 Years ended March 31, 2020 $5 % of sales % of sales 100.0% 70.1% 29.9% 100.0% 85.1% 14.9% 16.4% 0.8% 12.6% 9.2% 0.3% 0.1% 5.3% $'s 2019 708 593 115 61 % of sales 100.0% 83.8% 16.2% Year Ended March 31, 2021 Compared with Year Ended March 31, 2020 CIS net sales decreased $92 million, or 15 percent, in fiscal 2021 compared with the prior year, primarily due to lower sales volume associated with the impacts of the COVID-19 pandemnic and lower sales to a significant data center customer, partially offset by a $13 million favorable impact of foreign currency exchange rate changes. Sales to data center cooling and commercial HVAC&R customers decreased $60 million and $43 million, respectively. 8.6% 0.1% 7.5% Hedging and Foreign Currency Forward Contracts We use derivative financial instruments as a tool to manage certain financial risks. We prohibit the use of leveraged derivatives. Commodity Derivatives From time to time, we enter into over-the-counter forward contracts related to forecasted purchases of aluminum and copper. Our strategy is to reduce our exposure to changing market prices of these commodities. In fiscal 2021 and 2020, we designated certain commodity forward contracts as cash flow hedges for accounting purposes. Accordingly, for these designated hedges, we record unrealized gains and losses related to the change in the fair value of the contracts in other comprehensive income (loss) within shareholders' equity and subsequently recognize the gains and losses within cost of sales as the underlying inventory is sold. In fiscal 2021, 2020 and 2019, net gains and losses recognized in cost of sales related to commodity forward contracts were less than $1 million in each year." Foreign Currency Forward Contracts We use derivative financial instruments in a limited way to mitigate foreign currency exchange risk. We periodically enter into foreign currency forward contracts to hedge specific foreign currency-dehominated assets and liabilities as well as forecasted transactions. We have designated certain hedges of forecasted transactions as cash flow hedges for accounting purposes. Accordingly, for these designated hedges, we record unrealized gains and losses related to the change in the fair value of the contracts in other comprehensive income (loss) within shareholders' equity and subsequently recognize the gains and losses as a component of earnings at the same time and in the same financial statement line that the underlying transactions impact earnings. In fiscal 2021, 2020, and 2019, net gains and losses recognized in sales and cost of sales related to foreign currency forward contracts were less than $1 million in each year. We have not designated forward contracts related to foreign currency- denominated assets and liabilities as hedges. Accordingly, for these non-designated contracts, we record unrealized gains and losses related to the change in the fair value of the contracts in other income and expense. Gains and losses on these non-designated foreign currency forward contracts are offset by foreign currency gains and losses associated with the related assets and liabilities. Counterparty Risks We manage counterparty risks by ensuring that counterparties to derivative instruments maintain credit ratings acceptable to us. At March 31, 2021, all counterparties had a sufficient long-term credit rating. Table of Contents ITEM 8. Net sales Cost of sales FINANCIAL STATEMENTS AND SUPPLEMENTARY DATA. Gross profit Selling, general and administrative expenses Restructuring expenses Impairment charges (Gain) loss on sale of assets Operating (loss) income Interest expense Other expense - net (Loss) earnings before income taxes (Provision) benefit for income taxes Net (loss) earnings Net earnings attributable to noncontrolling interest Net (loss) earnings attributable to Modine MODINE MANUFACTURING COMPANY CONSOLIDATED STATEMENTS OF OPERATIONS For the years ended March 31, 2021, 2020 and 2019 (In millions, except per share amounts) Net (loss) earnings per share attributable to Modine shareholders: Basic Diluted Table of Contents Weighted-average shares outstanding: Basic Diluted The notes to consolidated financial statements are an integral part of these statements. Net (loss) earnings Other comprehensive income (loss): Foreign currency translation 44 Defined benefit plans, net of income taxes of $10.4, ($8.3) and ($0.3) million Cash flow hedges, net of income taxes of $0.6, ($0.5) and $0.1 million Total other comprehensive income (loss) Comprehensive income (loss) Comprehensive (income) loss attributable to noncontrolling interest Comprehensive income (loss) attributable to Modine The notes to consolidated financial statements are an integral part of these statements. $ 45 $ MODINE MANUFACTURING COMPANY CONSOLIDATED STATEMENTS OF COMPREHENSIVE INCOME For the years ended March 31, 2021, 2020 and 2019 (In millions) 2021 $ 1,808.4 $ 1,515.0 293.4 210.9 13.4 166.8 (97.7) (19.4) (2.2) (119.3) (90.2 (209.5 (1.2) (210.7) S (4.11) S (4.11) s 51.3 51.3 2021 (209.5) S 30.9 30.1 1.6 62.6 (146.9) (1.7) (148.6) 2020 1,975.5 1,668.0 307.5 249.6 12.2 8.6 (0.8) 37.9 (22.7) (4.8) 10.4 (12.4) (2.0) (0.2 (2.2) (0.04) S (0.04) S 50.8 50.8 2020 S (2.0) S (19.2) (24.6) (1.5) (45.3) (47.3) 0.2 (47.1) S 2019 2,212.7 1,847.2 365.5 244.1 9.6 0.4 1.7 109.7 (24.8) (4.1) 80.8 5.1 85.9 (1.1) 84.8 1.67 1.65 50.5 51.3 2019 85.9 (37.6) (1.4) 0.4 (38.6) 47.3 (0.6) 46.7 Table of Contents Net (loss) earnings Other comprehensive income (loss): Foreign currency translation Defined benefit plans, net of income taxes of $10.4, ($8.3) and ($0.3) million Cash flow hedges, net of income taxes of $0.6, ($0.5) and $0.1 million Total other comprehensive income (loss) Comprehensive income (loss) Comprehensive (income) loss attributable to noncontrolling interest Comprehensive income (loss) attributable to Modine The notes to consolidated financial statements are an integral part of these statements. Table of Contents ASSETS Cash and cash equivalents Trade accounts receivable - net Inventories Assets held for sale Other current assets Total current assets Property, plant and equipment - net Intangible assets-net Goodwill Deferred income taxes Other noncurrent assets Total assets MODINE MANUFACTURING COMPANY CONSOLIDATED STATEMENTS OF COMPREHENSIVE INCOME For the years ended March 31, 2021, 2020 and 2019 (In millions) LIABILITIES AND SHAREHOLDERS' EQUITY Short-term debt Long-term debt-current portion Accounts payable Accrued compensation and employee benefits Liabilities held for sale Other current liabilities Total current liabilities Long-term debt Deferred income taxes Pensions Other noncurrent liabilities Total liabilities Commitments and contingencies (see Note 20) Shareholders' equity Total Modine shareholders' equity Noncontrolling interest MODINE MANUFACTURING COMPANY CONSOLIDATED BALANCE SHEETS March 31, 2021 and 2020 (In millions, except per share amounts) Accumulated other comprehensive loss Treasury stock, at cost, 2.7 million and 2.5 million shares Table of Contents Preferred stock, $0.025 par value, authorized 16.0 million shares, issued - none Common stock, $0.625 par value, authorized 80.0 million shares, issued 54.3 million and 53.4 million shares Additional paid-in capital Retained earnings Total equity Total liabilities and equity The notes to consolidated financial statements are an integral part of these statements. 40 $ HODINIET BEA SIENA CTEDING COMPANIET 2021 (209.5) 30.9 30.1 1.6 62.6 S (146.9) (1.7) (148.6) S S S 2020 (2.0 (19.2 (24.6) (1.5) (45.3) (47.3) 0.2 (47.1) S 2021 37.8 267.9 195.6 107.6 35.9 644.8 269.9 100.6 170.7 24.5 66.2 1,276.7 1.4 21.9 233.9 66.5 103.3 42.2 469.2 311.2 5.9 S 58.6 75.7 920.6 S S 33.9 255.0 259.2 (161.2) (38.2) 348.7 7.4 356.1 1,276.7 S 2019 85.9 (37.6) (1.4) 0.4 (38.6) 47.3 2020 (0.6) 46.7 70.9 292.5 207.4 62.5 633.3 448.0 106.3 166.1 104.8 77.6 1,536.1 14.8 15.6 227.4 65.0 49.2 372.0 452.0 8.1 130.9 79.5 1,042.5 33.3 245.1 469.9 (223.3) (37.1) 487.9 5.7 493.6 1,536.1 Table of Contents Cash flows from operating activities: Net (loss) earnings Impairment charges (Gain) loss on sale of assets Stock-based compensation expense Deferred income taxes Adjustments to reconcile net (loss) earnings to net cash provided by operating activities: Depreciation and amortization Other - net Changes in operating assets and liabilities: Trade accounts receivable Inventories Accounts payable Accrued compensation and employee benefits Other assets Other liabilities Net cash provided by operating activities MODINE MANUFACTURING COMPANY CONSOLIDATED STATEMENTS OF CASH FLOWS For the years ended March 31, 2021, 2020 and 2019 (In millions) Cash flows from investing activities: Expenditures for property, plant and equipment Proceeds from dispositions of assets Proceeds from sale of investment in affiliate Proceeds from maturities of short-term investments Purchases of short-term investments Other-net Net cash used for investing activities Cash flows from financing activities: Borrowings of debt Repayments of debt Borrowings on bank overdraft facilities - net 40 Dividend paid to noncontrolling interest Purchase of treasury stock under share repurchase program Financing fees paid Other - net Net cash (used for) provided by financing activities Table of Contents Effect of exchange rate changes on cash Net (decrease) increase in cash, cash equivalents, restricted cash and cash held for sale Cash, cash equivalents, restricted cash and cash held for sale - beginning of year Cash, cash equivalents, restricted cash and cash held for sale - end of year The notes to consolidated financial statements are an integral part of these statements. $ 2021 MODINE MANUFACTURING COMPANY CONSOLIDATED STATEMENTS OF SHAREHOLDERS' EQUITY (209.5) S Boga. Nag@ ada. J 149.8 32.7 (183.6) 3.6 (0.8) 3.0 (145.1 1.4 (25.2) 71.3 46. 2020 (2.0) S 77.1 8.6 (0.8) 6.6 1.0 5.6 ..@@@CECA 36.6 (12.0) (37.7) (15.2) 14.7 (24.6) 57.9 (71.3) 6.2 3.8 4.1 (3.3) (60.5) 672.0 (630.3) 1.2 (1.3) (2.4) (2.8 (3.1) 33.3 (1.6) 42.2 71.3 2019 85.9 76.9 0.4 1.7 7.9 (4.4) 5.3 (15.3) (22.0) 16.6 (10.1) (11.8) (27.8) 103.3 (73.9) 0.3 4.9 (3.8) (0.3) (72.8) 221.3 (241.9) (0.1) (1.8) (0.6) (2.8) (25.9) (2.7) 1.9 40.3 42.2 Table of Contents Balance, March 31, 2018 Adoption of new accounting guidance (Note 1) Net earnings Other comprehensive loss Stock options and awards Purchase of treasury stock Stock-based compensation expense Dividend paid to nonconfrolling interest Balance, March 31, 2019 Net (loss) earnings Other comprehensive loss Stock options and awards Purchase of treasury stock Stock-based compensation expense Dividend paid to nonconfrolling interest Balance, March 31, 2020 Net (loss) earnings Other comprehensive income Stock options and awards Purchase of treasury stock Stock-based Table of Contents Common stock Shares Amount 52.3 $ 32.7 0.5 52.8 0.6 MODINE MANUFACTURING COMPANY CONSOLIDATED STATEMENTS OF SHAREHOLDERS' EQUITY For the years ended March 31, 2021, 2020 and 2019 (In millions) 53.4 0.9 GEORGE 0.3 THEIGH 33.0 3 0.3 HO imp!! 33.3 0.6 Additional paid-in capital Retained earnings $ 229.9 S 394.9 lol lool IE 0.8 7.9 238.6 (0.1) 6.6 245.1 3.6 LE (7.6) 84.8 *********00 472.1 (2.2) 469.9 (210.7 48 Accumulated other comprehensive loss compensation expense 54.3 $ 33.9 $ 6.3 255.0 S 259.2 $ Balance, March 31, 2021 The notes to consolidated financial statements are an integral part of these statements. $ (140.3) $ (38.1) (178.4) (44.9) (223.3) 62.1 Treasury stock, at cost MODINE MANUFACTURING COMPANY NOTES TO CONSOLIDATED FINANCIAL STATEMENTS (In millions, except per share amounts) (27.1) S THEORIE (4.3) (31.4) (5.7) Non-controlling interest (37.1) (161.2) $ (38.2) $ 8.4 $ 1.1 (0.5 TO BE I ak@......... @RNG. (1.8) TH 7.4 $ Total 498.5 (7.6) 85.9 (38.6) 1.1 (4.3) 7.9 (1.8) 541.1 (2.0) (45.3) 0.2 (5.7 6.6 (1.3) 493.6 (209.5) 62.6 4.2 6.3 356.1 Note 1: Significant Accounting Policies Nature of Operations Modine Manufacturing Company ("Modine" or the "Company") specializes in providing innovative thermal management solutions to diversified global markets and customers. The Company is a global leader in thermal management technology and solutions for sale into a wide array of commercial, industrial, and building heating, ventilating, air conditioning, and refrigeration ("HVAC&R") markets. In addition, the Company is a leading provider of engineered heat transfer systems and high-quality heat transfer components for use in on- and off-highway original equipment manufacturer ("OEM" vehicular applications. The Company's primary product groups include i) heating, ventilation and air conditioning; ii) coils, coolers, and coatings; and iii) powertrain cooling and engine cooling. COVID-19 In March 2020, the World Health Organization declared the outbreak of the novel coronavirus, COVID-19, a pandemic. See Note 20 for additional information regarding the risks and uncertainties to our business resulting from this global pandemic. Disposition of Air-cooled Automotive Business On February 19, 2021, the Company signed a definitive agreement to sell its air-cooled automotive business to Schmid Metall GmbH. In connection with this sale, which closed on April 30, 2021, the Company classified the air-cooled automotive business as held for sale as of March 31, 2021. Accordingly, the Company has reported the assets and liabilities of this business as held for sale on the March 31, 2021 consolidated balance sheet. See Note 2 for additional information. Jy samicci Net (loss) earnings Other comprehensive income (loss): Foreign currency translation Defined benefit plans, net of income taxes of $10.4, ($8.3) and ($0.3) million Cash flow hedges, net of income taxes of $0.6, ($0.5) and $0.1 million Total other comprehensive income (loss) Comprehensive income (loss) Comprehensive (income) loss attributable to noncontrolling interest Comprehensive income (loss) attributable to Modine The notes to consolidated financial statements are an integral part of these statements. Table of Contents ASSETS Cash and cash equivalents Trade accounts receivable - net Inventories Assets held for sale Other current assets Total current assets roperty, plant and equipment - net Intangible assets-net Goodwill Deferred income taxes Other noncurrent assets Total assets MODINE MANUFACTURING COMPANY CONSOLIDATED STATEMENTS OF COMPREHENSIVE INCOME For the years ended March 31, 2021, 2020 and 2019 (In millions) LIABILITIES AND SHAREHOLDERS' EQUITY Short-term debt Long-term debt-current portion Accounts payable Accrued compensation and employee benefits Liabilities held for sale Other current liabilities Total current liabilities Long-term debt Deferred income taxes Pensions Other noncurrent liabilities Total liabilities 45 MODINE MANUFACTURING COMPANY CONSOLIDATED BALANCE SHEETS March 31, 2021 and 2020 (In millions, except per share amounts) Commitments and contingencies (see Note 20) Shareholders' equity: Preferred stock, $0.025 par value, authorized 16.0 million shares, issued - none Accumulated other comprehensive loss Treasury stock, at cost, 2.7 million and 2.5 million shares Total Modine shareholders' equity Noncontrolling interest Table of Contents Total equity Total liabilities and equity The notes to consolidated financial statements are an integral part of these statements. $ Common stock, $0.625 par value, authorized 80.0 million shares, issued 54.3 million and 53.4 million shares Additional paid-in capital Retained earnings 46 2021 MODINE MANUFACTURING COMPANY CONSOLIDATED STATEMENTS OF CASH FLOWS For the years ended March 31, 2021, 2020 and 2019 (In millions) (209.5 30.9 30.1 1.6 62.6 (146.9) (1.7 (148.6) $ S 2020 (2.0) S (19.2) (24.6) (1.5) (45.3) (47.3 0.2 (47.1) S 2021 37.8 267.9 195.6 107.6 35.9 644.8 269.9 100.6 170.7 24.5 66.2 1,276.7 233.9 66.5 103.3 42.2 469.2 311.2 5.9 1.4 S 21.9 58.6 75.7 920.6 S 33.9 255.0 259.2 (161.2) (38.2) 348.7 7.4 356.1 1,276.7 S 2019 85.9 (37.6) (1.4) 0.4 (38.6) 47.3 (0.6) 46.7 2020 70.9 292.5 207.4 62.5 633.3 448.0 106.3 166.1 104.8 77.6 1,536.1 14.8 15.6 227.4 65.0 49.2 372.0 452.0 8.1 130.9 79.5 1,042 5 33.3 245.1 469.9 (223.3) (37.1) 487.9 5.7 493.6 1,536.1 rable of Contovics Cash flows from operating activities: Net (loss) earnings Adjustments to reconcile net (loss) earnings to net cash provided by operating activities: Depreciation and amortization Impairment charges (Gain) loss on sale of assets Stock-based compensation expense Deferred income taxes Other - net Changes in operating assets and liabilities: Trade accounts receivable Inventories Accounts payable Accrued compensation and employee benefits Other assets Other liabilities Net cash provided by operating activities Cash flows from investing activities: Expenditures for property, plant and equipment Proceeds from dispositions of assets Proceeds from sale of investment in affiliate MODINE MANUFACTURING COMPANY CONSOLIDATED STATEMENTS OF CASH FLOWS For the years ended March 31, 2021, 2020 and 2019 (In millions) Proceeds from maturities of short-term investments Purchases of short-term investments Other - net Net cash used for investing activities Cash flows from financing activities: Borrowings of debt Repayments of debt Borrowings on bank overdraft facilities - net Dividend paid to noncontrolling interest Purchase of treasury stock under share repurchase program Financing fees paid Other - net Net cash (used for) provided by financing activities Effect of exchange rate changes on cash Net (decrease) increase in cash, cash equivalents, restricted cash and cash held for sale Cash, cash equivalents, restricted cash and cash held for sale - beginning of year Cash, cash equivalents, restricted cash and cash held for sale - end of year The notes to consolidated financial statements are an integral part of these statements. $ 2021 (209.5) 68.6 166.8 se....H BECA.F@ Exact da... (145.1) 14 (25.2) 71.3 46.1 $ 2020 (2.0) S FRESEASEESE) 77.1 8.6 (0.8) 6.6 1.0 5.6 36.6 (12.0) (37.7) (15.2) 14.7 (24.6) 57.9 (71.3) 6.2 3.8 4.1 (3.3) (60.5) (630.3) (1.3) HAZ: 2019 85.9 76.9 0.4 1.7 7.9 (4.4) 5.3 (15.3) (22.0) 16.6 (10.1) (11.8) (27.8) 103.3 (73.9) 0.3 4.9 (3.8) (0.3) (72.8) 221.3 (241.9) (0.1) (1.8) (0.6) (2.8) (25.9) (2.7) 1.9 40.3 42.2 Goodwill The Company does not amortize goodwill; rather, it tests for impairment annually unless conditions exist that would require a more frequent evaluation. The Company performs an assessment of the fair value of its reporting units for goodwill impairment testing based upon, among other things, the present value of expected future cash flows. The Company performed its goodwill impairment test as of March 31, 2021 and determined the fair value of each of its reporting units exceeded the respective book value. See Note 14 for additional information. Impairment of Held and Used Long-lived Assets The Company reviews held and used long-lived assets, including property, plant and equipment and intangible assets, for impairment whenever events of changes in circumstances indicate that the carrying amount of the asset may not be fully recoverable. In these instances, the Company compares the undiscounted future cash flows expected to be generated from the assef with its carrying value. If the asset's carrying value exceeds expected future cash flows, the Company measures and records an impairment loss, if any, as the amount by which the carrying value of the asset exceeds its fair value. The Company estimates fair value using a variety of valuation techniques, including discounted cash flows, market values and comparison values for similar assets. Assets Held for Sale The Company considers assets to be held for sale when management approves and commits to a formal plan to actively market the asset for sale at a reasonable price in relation to its fair value, the asset is available for immediate sale in its present condition, an active program to locate a buyer and other actions required to complete the sale have been initiated, the sale of the asset is expected to be completed within one year and it is unlikely that significant changes will be made to the plan. Upon designation as held for sale, the Company records the carrying value of the assets at the lower of its carrying valufe or its estimated fair value, less costs to sell. The Company ceases to record depreciation expense at the time of designation as held for sale. During fiscal 2021, the Company classified the liquid- and air-cooled automotive businesses as held for sale and recorded impairment charges totaling $166.8 million within the Automotive segiment. See Note 2 for additional information. Deferred Compensation Trusts The Company maintains deferred compensation trusts to fund future obligations under its non-qualified deferred compensation plans. The trusts' investments in third-party debt and equity securities are presented within other noncurrent assets in the consolidated balance sheets. Self-insurance Reserves Company retains a portion of the financial risk for certain insurance coverage, including property, general liability, workers compensation, and employee healthcare, and therefore maintains reserves that estimate the impact of unreported and under-reported claims that fall below various stop-loss limits and deductibles under its insurance policies. The Company maintains reserves for the estimated settlement cost of known claims, as well as estimates of incurred but not reported claims. The Company charges costs of claims, including the impact of changes in reserves due to claim experience and severity, to operations. The Company reviews and updates the amount of its insurance-related reserves on a quarterly basis. Environmental Liabilities The Company records liabilities for environmental assessments and remediation activities in the period in which its responsibility is probable and the costs can be reasonably estimated. The Company records environmental indemnification assets from third parties, including prior owners, when recovery is probable. To the extent that the required remediation procedures change, or additional contamination is identified, the Company's estimated environmental liabilities may also change. See Note 20 for additional information. Table of Contents Supplemental Cash Flow Information Interest paid Income taxes paid 32 MODINE MANUFACTURING COMPANY NOTES TO CONSOLIDATED FINANCIAL STATEMENTS (In millions, except per share amounts) Years ended March 31, 2021 2019 17.9 $ 19.7 2020 21.4 $ 18.8 See Note 16 for supplemental cash flow information related to the Company's leases. New Accounting Guidance Adopted in Fiscal 2021 Table of Contents Credit Losses In June 2016, the Financial Accounting Standards Board ("FASB") issued new guidance related to the accounting for credit losses for certain financial assets, including trade accounts receivable and contract assets. The new guidance modifies the credit loss model to measure and recognize credit losses based upon expected losses rather than incurred losses. The Company adopted this guidance as of April 1, 2020. The adoption did not have a material impact on the Company's consolidated balance sheets, statements of operations or statements of cash flows. New Accounting Guidance Adopted in Fiscal 2020 22.3 22.2 Leases In February 2016, the FASB issued new comprehensive lease accounting guidance that requires balance sheet recognition for most leases. The Company adopted this guidance effective April 1, 2019 using a modified-retrospective transition method, under which it elected not to adjust comparative periods. The Company elected the package of practical expedients permitted under the new guidance, and, as a result, the Company did not reassess the classification of existing leases or initial direct costs thereof, or whether existing contracts contain leases. In addition, the Company elected accounting policies to not record short-term leases on the balance sheet and to not separate lease and non-lease components. The Company did not elect the hindsight practical expedient. Upon adoption of this new guidance on April 1, 2019, the Company recognized right-of-use assets for operating leases totaling $61.3 million and corresponding current and noncurrent operating lease liabilities of $12.4 million and $48.9 million, respectively. In addition, the Company assessed two existing buttd-to-suit arrangements, for which it had recorded property, plant and equipment and long-term debt on its consolidated balance sheet as of March 31, 2019. The Company determined these arrangements represent operating leases under the new accounting guidance. As a result, the Company derecognized the previously-recorded balances and recorded $5.2 million of operating lease right-of-use assets and corresponding lease liabilities. As a result of adopting the new guidance, there was not a significant impact on the Company's accounting for its previously-recorded capital leases, which are now classified as finance leases under the new guidance. In addition, there was no impact to retained Earnings. Also, the adoption did not have a material impact on the Company's consolidated statement of operations or consolidated Statement of cash flows. See Note 16 for additional information regarding the Company's leases. in February 2018, the FASB issued new guidance related to the accounting for certain stranded income tax effects in accumulated other comprehensive income (loss) resulting from tax reform legislation that was enacted in the U.S. in December 2017. This guidance provided companies the option to reclassify stranded income tax effects to retained earnings. The Company adopted this guidance as of April 1, 2019 and chose not to reclassify stranded income tax effects; therefore, the adoption of this guidance did not impact the Company's consolidated financial statements. New Accounting Guidance Adopted in Fiscal 2019 Revenue Recognition In May 2014, the FASB issued new guidance that outlines a comprehensive model for entities to use in accounting for revenue arising from contracts with customers. The core principle of the new guidance is that companies are to recognize revenue to depict the transfer of goods or services to customers in an amount that reflects the consideration to which the entity expects to be entitled in exchange for those goods or services. The Company adopted this new guidance for fiscal 2019 using the modified-retrospective transition method. As a result of its adoption of the new guidance, the Company recorded an increase of $0.7 million to retained earnings as of April 1, 2018, along with related balance sheet Feclassifications. See Note 3 for additional information regarding revenue recognition. 53 MODINE MANUFACTURING COMPANY NOTES TO CONSOLIDATED FINANCIAL STATEMENTS (In millions, except per share amounts) the first quarter of fiscal 2022. The estimated loss on sale ince to the daing sale of the liquid-cooled automotive business, described above this transaction i in relation On February 19, 2021, the Company signed a definitive agreement to sell its air-cooled automotive business to Schmid Metall GmbH. This transaction closed on April 30, 2021. Based upon its preliminary accounting, the Company expects to record a loss on sale of approximately $6.0 million during s for cash, debt, i working capital, as defined within the above, and ed agreement. The Company evaluated this t to concluded each represents a separate disposal group for purposes of assessing discontinued operations. The Company determined that the air-cooled disposal group did not qualify as a discontinued opration. The Company reports financial results of both the liquid- and air-cooled automotive businesses within its Automotive segment. Once the Company entered into the Sale agreements with Board of Director approval, it classified the businesses as held for sale beginning on November 2, 2020 and February 19, 2021, respectively, and ceased depreciating the long-lived assets within the disposal groups. Upon classification as held for sale, the Company compared each disposal group's carrying value with its fair value, less costs to sell. Based upon the selling prices for each transaction, the Company estimated implied losses in excess of the respective carrying value of each disposal group's long-lived assets. The disposal groups' long-lived assets consist entirely of property, plant and equipment and right-of-use lease assets. As a result, the Company recorded non-cash impairment charges totaling $165.1 million during fiscal 2021 to reduce the net carrying value of the disposal groups' long-lived assets to zero. The impairment charges related to the liquid- and air-cooled automotive businesses totaled $138.3 million and $26.8 million, respectively. Also during fiscal 2021, the Company recorded an impairment charge of $1.7 million within the Automotive segment related to equipment that will not convey as part of the sale transactions and is not expected to be used within the Company's other businesses. These charges are reported within the impairment charges line on the consolidated statements of operations. Table of Contents ASSETS Cash and cash equivalents Trade accounts receivables - net Inventories. Other current assets. Property, plant and equipment - net Other noncurrent assets Impairment of carrying value Total assets held for sale The Company classified the assets and liabilities of the liquid- and air-cooled automotive businesses s held for sale on the March 31, 2021 consolidated balance sheet. The major classes of assets and liabilities held for sale were as follows: March 31, 2021 LIABILITIES Short-term debt Accounts payable Accrued compensation and employee benefits Other current liabilities. Pensions Other noncurrent liabilities Total liabilities held for sale. 54 MODINES MANATADINANCIAL STATEMENTS (In millions, except per share amounts) NOTES $ Table of Contents 8.0 54.4 24.7 12.8 164.0 8.8 (165.1 107.6 5.0 The Company will reassess the liquid-cooled disposal group's fair value less costs to sell at each reporting period that it is held for sale until the transaction is completed. The Company expects to record loss on sale of approximately $ The loss on sale retorded will be impacted by changes in working capital, costs to sell, nt a million to $30.0 million upon transaction completion. 46.3 15.5 12.2 17.8 6.5 103.3 al losses in accumulated other comprehensive loss related to the disposal group's pension plans, and cumulative translation adjustments. It is possible that the loss on sale recorded could differ materially from the Company's estimate Note 3: Revenue Recognition. 55 The Company generates revenue from selling innovative thermal management products and solutions to diversified global markets and customers. The Company recognizes revenue based upon consideration specified in a contract and as it satisfies performance obligations by transferring control over its products to its customers, which may be at a point in time or over time. The majority of the Company's revenue is recognized at a point in time, based upon shipment terms. The Company records an allowance for credit losses and accrues for estimated warranty costs at the time of sale. These estimafes are , and current economic conditions. The Company accounts for shipping and handling activities as fulfilment costs rather than separate sales and related amounts billed to customers in net sales. The Company establishes paynfent terms with its customers based upon industry and regional practices, which typically do not exceed 90 days. As the Company expects to receive payment from its customers within one year from the time of sale, it disregards the effects of the time value of money in its determination of the transaction price. The Company has not disclosed the value of unsatisfied performance obligations because the revenue associated with customer contracts for which the original expected performance period is greater than one year is immaterial. historical experience, current business treformance obligations and records shipping and handling costs in cost of The following is a description of the Company's principal revenue-generating activities: Building HVAC Systems ("BHVAC") a commercial buildings and data centers in North America and the U.K., as well as mainland Europe and the Middle East, products, primarily for Heating products are manufactured in the U.S. and are largely sold to independent distributors, who in turn market the heating products to end customers. Because these products are sold to many different customers without contractual or practical limitations, the BHVAC segment recognizes revenue at the time control is transferred to the customer, generally the independent distributor, based upon shipping terms, which is generally upon shipment. Table of Contents Disaggregation of Revenue The tables below present revenue to external customers for each of the Company's business segments by primary end market, geographic location, and based upon the timing of revenue recognition: Primary end market: Commercial HVAC&R Data center cooling Industrial cooling Commercial vehicle Off-highway Automotive and light vehicle Other Net sales Geographic location: Americas Europe Asia Net sales Timing of revenue recognition: Products transferred at a point in time Products transferred over time Net sales Primary end market: Commercial HVAC&R Data center cooling Industrial cooling Commercial vehicle Off-highway Automotive and light vehicle Other Net sales Geographic location: Americas Europe Asia Net sales Timing of revenue recognition: Products transferred at a point in time Products transferred over time Net sales MODINE MANUFACTURING COMPANY NOTES TO CONSOLIDATED FINANCIAL STATEMENTS (In millions, except per share amounts) Table of Contents BHVAC MOTEC to 2655C 181.6 58.7 0.3 240.6 144.2 96.4 240.6 240.6 240.6 $ BHVAC 176.6 42.7 1.8 221.1 221.1 $ $ 139.1 $ 82.0 221.1 57 $ 221.1 $ CIS CIS Year ended March 31, 2021 HDE 420.6 47.3 55.4 8.7 532.0 267.7 $ 219.8 44.5 532.0 486.3 45.7 532.0 463.1 107.5 43.5 9.8 623.9 345.9 232.6 45.4 623.9 518.2 105.7 623.9 MODINE MANUFACTURING COMPANY Year ended March 31, 2020 HDE $ 250.4 260.7 SCHAL PRATEN JUMPE 97.9 73.1 682.1 388.2 133.2 160.7 682.1 655.2 26.9 682.1 302.1 240.8 108.4 94.6 745.9 Automotive 484.5 141.2 120.2 745.9 $ $ 14.4 3.4 715.1 $ 30.8 745.9 357.8 22.7 398.3 51.0 $ 282.0 65.3 398.3 $ 398.3 Automotive 398.3 21.6 13.1 400.4 9.8 444.9 $ 70.3 321.0 53.6 444.9 444.9 444.9 $ $ $ $ $ $ Segment Total 602.2 106.0 55.4 264.8 264.1 455.7 104.8 1,853.0 851.1 731.4 270.5 1.853.0 1,780.4 72.6 1,853.0 Segment Total 639.7 150.2 43.5 323.7 253,9 508.8 116.0 2,035.8 1,039.8 776.8 219.2 2,035.8 1,899.3 136.5 2,035.8 Table of Contents Primary end market: Commercial HVAC&R Data center cooling Industrial cooling Commercial vehicle Off-highway Automotive and light vehicle Other Net sales Geographic location: Americas Europe Asia Net sales Timing of revenue recognition: Products transferred at a point in time Products transferred over time Net sales Contract assets Contract liabilities MODINE MANUFACTURING COMPANY NOTES TO CONSOLIDATED FINANCIAL STATEMENTS (In millions, except per share amounts) BHVAC 167.7 41.3 . 3.4 212.4 124.9 87.5 212.4 212.4 212.4 $ Contract Balances Contract assets and contract liabilities from contracts with customers were as follows: $ CIS 38 Year ended March 31, 2019 HDE 506.3 145.7 47.8 7.8 707.6 413.6 $ 244.8 49.2 707.6 March 31, 2021 March 31, 2020 $ 5.7 $ 21.7 5.6 5.6 571.1 136.5 707.6 $ 352.6 298.1 116.7 104.9 872.3 543.0 177.4 151.9 872.3 829.1 43.2 872.3 Automotive $ $ 35.0 16.0 426.1 11.8 488.9 71.0 369.4 48.5 488.9 $ 488.9 $ 488.9 Segment Total 674.0 187.0 47.8 387.6 314.1 542.8 127.9 2,281.2 1,152.5 879.1 249.6 2,281.2 At March 31, 2021, contract assets and contract liabilities exclude amounts classified as held for sale. See Note 2 for additional information. Contract assets, included within other current assets in the consolidated balance sheets, primarily consist of capitalized costs related to customer- owned tooling contracts, wherein the customer has guaranteed reimbursement, and assets recorded for revenue recognized over time, which represent the Company's rights to consideration for work completed but not yet billed. The $16.0 million decrease in contract assets during fiscal 2021 primarily resulted from a decrease in contract assets for revenue recognized over time and $7.1 million of contract assets within the liquid- and air- cooled automotive businesses that have been classified as held for sale on the March 31, 2021 consolidated balance sheet. 2,101.5 179.7 2,281.2 Contract liabilities, included within other current liabilities in the consolidated balance sheets, consist of payments received in advance of satisfying performance obligations under customer contracts, including contracts for customer-owned tooling. During fiscal 2021, increases related to customer contracts for which payment was received in advance of the Company's satisfaction of performance obligations was offset by $2.9 million of contract liabilities within the liquid- and air-cooled automotive businesses that have been classified as held for sale on the March 31, 2021 consolidated balance sheet. Note 4: Fair Value Measurements Fair value is defined as the price that would be received for an asset or paid to transfer a liability in the principal or most advantageous market for the asset or liability in an orderly transaction between market participants. Fair value measurements are classified under the following hierarchy: : Level 1 - Quoted prices for identical instruments in active markets. Level 2 - Quoted prices for similar instruments in active markets; quoted prices for identical or similar instruments in markets that are not active and model-derived valuations in which all significant inputs are observable in active markets. Level 3-Model-derived valuations in which one or more significant inputs are not observable. withdrawals during fiscal 2021. Plan assets related to the Company's pension plans were classified as follows: Money market investments Fixed income securities Pooled equity funds U.S. government and agency securities Other Fair value excluding investments measured at net asset value Investments measured at net asset value Total fair value Money market investments Fixed income securities. Pooled equity funds U.S. government and agency securities Other Fair value excluding investment measured at net asset value Investments measured at net asset value Total fair value Table of Contents 39 Fair value of options Expected life of awards in years Risk-free interest rate. Level 1 37.3 Expected volatility of the Company's stock Expected dividend yield on the Company's stock 0.1 37.4 $ Level 1 17.9 2021 0.1 18.0 March 31, 2021 Level 2 S 00 2.5 $ 8.9 14.5 1.0 26.9 March 31, 2020 Level 2 NOTES TOPONSOLIDATED FINANG COMPANYENTS (In millions, except per share amounts) 2.4 S 8.7 13.1 0.7 24.9 S The Company determined the fair value of money market investments to approximate their net asset values, without discounts for credit quality or liquidity restrictions, and classified them within Level 2 of the valuation hierarchy. The Company determined the fair value of pooled equity funds based upon quoted prices from active markets and classified them within Level 1 of the valuation hierarchy. The Company determined the fair value of fixed income securities and U.S. government and agency securities based upon recent bid prices or the average of rcent bid and asking prices when available and, if not available, the Company valued them through matrix pricing models developed by sources considered by management to be reliable. The Company classified these assets within Level 2 of the valuation hierarchy. As of March 31, 2021 and 2020, the Company held no Level 3 assets within its pension plans. Total 2.5 8.9 37.3 145 1.1 As a practical expedient, the Company valued certain investments, including pooled equity, fixed income and a real estate fund, using their net asset valu ("NAV") per unit, and therefore, has not classified these investments within the fair value hierarchy. The terms and conditions for redemptions vary for the investments valued at NAV. The real estate and fixed income investment funds may be redeemed quarterly and monthly, respectively, with a 90-day and 60-day notice period, respectively. Other investments valued at NAV do not have significantly-restrictive redemption frequency or notice pertod requirements. The Company does not intend to sell or otherwise dispose of these investments at prices different than the NAV per unit. Note 5: Stock-Based Compensation 64.3 119.0 183.3 The Company's stock-based incentive programs consist of the following: (1) a long-term incentive plan ("LTIP") for officers and other executives that consists of stock awards, stock options, and performance-based stock awards granted for retention and performance, (2) a discretionary equity program for other management and key employees, and (3) stock awards for non-employee directors. The Company's Board of Directors and the Human Capital and Compensation Committe, s applicable, have discretionary authority to set the terms of the stock-based awards. Grants to employees during fiscal 2021 were issued under the Company's 2020 Incentive Compensation Plan. In lieu of performance-based stock awards, the Company granted performance cash awards to the LTIP participants in fiscal 2021. At present, the Company accomplishes the fulfillment of equity- based grants through the issuance of new common shares. As of March 31, 2021, approximately 1.7 million shares authorized under the 2020 Incentive Compensation Plan remain available for future grants. Employee participants have the opportunity to deliver back to the Company the number of shares from the vesting of stock awards sufficient to satisfy the individual's minimum tax withholding obligations. These shares are held as treasury shares. The Company recorded stock-based compensation expense of $6.3 million, $6.6 million, and $7.9 million in fiscal 2021, 2020, and 2019, respectively. Years ended March 31, 2020 2019 3.46 $ 5.56 $ 7.81 6.1 6.3 6.3 0.4% 2.2% 2.8% 54.1% 39.2% 39.7% 0.0% 0.0% 0.0% Total Stock Options The Company recorded $0.9 million, $1.3 million, and $1.2 million of compensation expense related to stock options in fiscal 2021, 2020, and 2019, respectively. The fair value of stock options that vested during fiscal 2021, 2020, and 2019, was $1.3 million, $1.2 million, and $1.2 million, respectively. As of March 31, 2021, the total compensation expense not yet recognized related to non-vested stock options was $1.8 million and the weighted-average period in which the remaining expense is expected to be recognized was 2.8 years. 2.4 8.7 17.9 13.1 0.8 The Company estimated the fair value of option awards on the date of grant using the Black-Scholes option valuation model and the following assumptions! 42.9 88.2 131.1 Stock options expire no later than 10 years after the grant date and have an exercise price equal to the fair market value of Modine's common stock on the date of grant. The risk-free Interest rate was based upon yields of U.S. Treasury zero-coupon issues with a term corresponding to the expected life of the options. The expected volatility assumption was based upon changes in the Company's historical common stock prices over the same time period as the expected life of the awards. The expected dividend yield is zero, as the Company currently does not anticipate paying dividends over the expected life of the options. The expected lives of the awards are based upon historical patterns and the terms of the options. Outstanding options granted vest 25 percent annually for four years. chopon Note 7: Other Income and Expense Other income and expense consisted of the following: Interest income Foreign currency transactions (a) Net periodic benefit cost (b) Equity in earnings of non-consolidated affiliate (c) Total other expense - net . Components of (loss) earnings before income taxes: United States Foreign Total (loss) earnings before income taxes Income tax provision (benefit): Federal: Current Deferred State: Current Deferred Foreign: MODINE MANUFACTURING COMPANY NOTES TO CONSOLIDATED FINANCIAL STATEMENTS (In millions, except per share amounts) (a) Foreign currency transactions primarily consist of foreign currency transaction gains and losses on the re-measurement or settlement of foreign currency-denominated assets and liabilities, including intercompany loans and transactions denominated in a foreign currency, along with gains and losses on foreign currency exchange contracts. (b) Net periodic benefit cost for the Company's pension and postretirement plans is exclusive of service cost (c) During fiscal2020, Current. Deferred Total income tax provision (benefit) the Company sold its ownership interest in Nikkei Heat Exchanger Company, Ltd. As a result of the sale, the Company recorded a gain of $0.1 million, which is included within the fiscal2020amount. See Notel for additional information. Note 8: Income Taxes The U.S. and foreign components of loss or earnings before income taxes and the provision or benefit for income taxes consisted of the following: Years ended March 31, 2020 Table of Contents Statutory federal tax State taxes, net of federal benefit Taxes on non-U.S. earnings and losses Valuation allowances Tax credits Compensation Tax rate or law changes 63 The reconciliation between the U.S. federal statutory rate and the Company's effective tax rate Uncertain tax positions, net of settlements. Notional interest deductions. Dividends and taxable foreign inclusions Other Effective tax rate MODINE MANUFACTURING COMPANY NOTES TO CONSOLIDATED FINANCIAL STATEMENTS (In millions, except per share amounts) $ $ 2021 21.0% 0.9 (9.1) 2021 (92.9) 2.2 (1.3) (0.2) 0.1 1.3 3.0 (0.6) (75.6%) 2021 (12.0) 32.9 156.9 (36.7) Years ended March 31, 2020 0.5 0.6 (3.3) 21.0% 4.0 3.6 (2.2) as follows: Years ended March 31, 2020 (37.9) (12.5) (11.0) 10.9 119.2% (48.7) S (70.6) (119.3 S O $ (0.1) s 58.3 0.4 9.2 22.0 0.4 90.2 a new On December 22, 2017, the U.S. government enacted comprehensive tax legislation commonly referred to as the Tax Act. The Tax Act included a r provision designed to tax global intangible low taxed incme ("GILTI") starting in fiscal 2019. The Company elected to record the tax effects of the GILTI provision as a period expense in the applicable tax year. To determine whether its net operating loss carryforward deferred tax assets are expected to be realized, the Company considers the applicable tax law ordering. Based upon this approach, net operating loss carryforwards are deemed to be realizable if they will reduce the expected tax liability when utilized, regardless of whether the 50% GILTI deduction or applicable tax credits may have been available. 0.4 (2.4) (3.0) 0.2 (4.8) $ 2019 S The Company's accounting policy is to allocate the income tax provision between net earnings and other comprehensive income. The Company applies its accounting for income taxes by tax jurisdiction, and in periods in which there is a loss before income taxes and pre-tax income in other comprehensive income, it first allocates the income tax provision to other comprehensive income, and then records a related tax benefit in the income tax provision. 21.09 3.6 3.9 4.0 (26.1) (0.1) (12.0) 0.4 (2.5) 1.6 (0.1) (6.3%) (26.1) S 36.5 10.4 (3.4 S (1.7) (0.1) (2.3) 2019 14.9 5.0 12.4 $ 0.4 (2.3) (2.9) 0.7 (4.1) 2019 22.4 58.4 80.8 (20.4) (4.2) 0.7 1.9 19.0 (2.1) (5.1) During fiscal 2021, the Company's effective tax rate was largely driven by both significant impairment charges and income tax charges related to valuation allowances. See Note 2 for information regarding the impairment charges recorded during fiscal 2021. The income tax benefits associated with these impairment charges totaled $24.4 million and $13.3 million in the U.S. and in certain foreign jurisdictions, respectively, and increased the deferred tax assets in the applicable jurisdictions. The deferred tax assets, in turn, were evaluated for realizability, as further described below. The Company records valuation allowances against its net deferred tax assets to the extent it determines it is more likely than not that such assets The tax effects of temporary differences that gave rise to deferred tax assets and liabilities were as follows: March 31, Deferred tax assets: Accounts receivable Inventories Plant and equipment. Lease liabilities Pension and employee benefits Net operating and capital losses Credit carryforwards Other, principally accrued liabilities Total gross deferred tax assets Less: valuation allowances i Net deferred tax assets Deferred tax liabilities: Plant and equipment Lease assets Goodwill Intangible assets Other Total gross deferred tax liabilities. Net deferred tax assets Beginning balance Gross increases - tax positions in prior period Gross decreases - tax positions in prior period Gross increases - tax positions in current period Settlements Lapse of statute of limitations Ending balance MODINE MANUFACTURING COMPANY NOTES TO CONSOLIDATED FINANCIAL STATEMENTS (In millions, except per share amounts) Table of Contents $ Germany. Italy. United States 2021 S 60 0.3 $ 4.5 7.5 14.0 24.0 Fiscal 2015-Fiscal 2020 Fiscal 2016- Fiscal 2020 Fiscal 2017 - Fiscal 2020 52.7 51.8 8.9 163.7 (90.7) 73.0 9.8 13.8 5.1 25.1 0.6 54.4 18.6 $ At March 31, 2021, the net deferred tax assets presented in the table above exclude deferred tax assets and liabilities classified as held for sale. At March 31, 2021, the Company recorded a full valuation allowance for the net deferred tax assets of the held for sale businesses. See Note 2 for additional information regarding the businesses held for sale. Unrecognized tax benefits were as follows: 9.7 $ 0.1 (0.6) 0.9 2020 (0.5) 9.6 0.3 4.5 4.7 15.7 45.1 MODINE MANUFACTURING COMPANY NOTES TO CONSOLIDATED FINANCIAL STATEMENTS (In millions, except per share amounts) 70.2 56.8 8.1 205.4 (46.9 158.5 Years ended March 31, 2021 2020 13.1 15.6 4.8 26.4 1.9 61.8 96.7 The Company's liability for unrecognized tax benefits as of March 31, 2021 was $9.6 million and, if recognized, $1.5 million would have an effective tax rate impact. The Company estimates a $2.4 million decrease in unrecognized tax benefits during fiscal 2022 due to lapses in statutes of limitations and settlements. If recognized, these reductions would not have a significant impact on the Company's effective tax rate." The Company recognizes interest and penalties related to unrecognized tax benefits as a component of income tax expense. During fiscal 2021 and 2020, interest and penalties included within income tax expense were not significant. At March 31, 2021 and 2020, accrued interest and penalties totaled $0.6 million and $0.5 million, respectively. 13.8 0.3 (1.0) 1.1 (2.1) (2.4 The Company files income tax returns in multiple jurisdictions and is subject to examination by taxing authorities throughout the world. At March 31, 2021, the Company was under income tax examination in a number of jurisdictions. The following tax years remain subject to examination for the Company's major tax jurisdictions: At March 31, 2021, the Company had federal and state tax credits of $60.5 million that if not utilized against U.S. taxes, will expire between fiscal 2022 and 2041. The Company also had state and local tax loss carryforwards totaling $135.8 million that, if hot utilized against state apportioned taxable income, will expire between fiscal 2022 and 2041. In addition, the Company had tax loss and foreign attribute carryforwards totaling $211.4 million in various tax jurisdictions throughout the world. Carryforwards in the U.S. and in certain foreign jurisdictions are offset by valuation allowances. If not utilized against taxable income, $6.8 million of these carryforwards will expire between fiscal 2022 and 2034, and $204.6 million, mainly related to the U.S, Germany and Italy, will not expire due to an unlimited carryforward period. - The Company's practice and intention is to reinvest, with certain insignificant exceptions, the earnings of its non-U.S. subsidiaries outside of the U.S., and therefore, the Company has not recorded foreign withholding taxes or deferred income taxes for these earnings. The Company has estimated the net amount of unrecognized foreign withholding tax and deferred tax liabilities would total approximately $10.0 million if the accumulated foreign earnings were distributed; however, the actual tax cost would be dependent on circumstances existing when remittance occurs. Lease Assets and Liabilities The following table provides a summary of leases recorded on the consolidated balance sheets. The March 31, 2021 amounts exclude operating lease assets and liabilities, which each totaled $6.1 million, that are classified as held for sale on the Company's consolidated balance sheet: see Note 2 for additional information. Lease Assets Operating lease ROU assets Finance lease ROU assets (a) Lease Liabilities. Operating lease liabilities Operating lease liabilities. Finance lease liabilities Finance lease liabilities Operating lease expense (a) Finance fease expense: Depreciation of ROU assets Interest on lease liabilities. Total lease expense Table of Contents Other noncurrent assets Property, plant and equipment - net Other current liabilities Other noncurrent liabilities. Long-term debt-current portion Long-term debt Balance Sheet Location (a) Finance lease ROU assets were recorded net of accumulated amortization of $2.4million and $1.8 million as of March 31, 2021 and 2020, respectively. Supplemental Cash Flow Information Weighted-average discount rate: Operating leases Finance leases Weighted-average remaining lease term: Operating leases Finance leases Components of Lease Expense e com records operating lease expense as either cost of sales or SG&A expenses within its consolidated statements of operations, depending upon the nature and use of the ROU assets. The Company records finance lease expense as depreciation expense within cost of sales or SG&A expenses, depending upon the nature and use of the ROU assets, and as interest expense in its consolidated statements of operations. The components of lease expense were as follows: Cash paid for amounts included in the measurement of lease liabilities: Operating cash flows for operating leases Financing cash flows for finance leases ROU assets obtained in exchange for lease liabilities Operating leases Finance leases Lease Term and Discount Rates 2024 2025 2026 2027 and beyond. Years ended March 31, 2021 2020 19.5 $ S $ 0.5 0.2 20.2 March 31, 2021 (a) In fiscal 2021 and 2020, operating lease expense included short-term lease expense of $3.5million and $4.1 million, respectively. Varable lease expense was not significant. 71 21.2 0.5 0.2 21.9 0.5 1.4 4.3 (0.7) 3.6 MODINE MANUFACTURING COMPANY NOTES TO CONSOLIDATED FINANCIAL STATEMENTS (In millions, except per share amounts). March 31, 2021 6.9 years 7.8 years. 54.1 8.3 $ 3.3% 4.7% March 31, 2020 61.4 8.5 S 11.2 S 44.8 0.4 3.2 $ Years ended March 31, 2021 2020 14.2 $ 0.6 9.8 $ 0.1 March 31, 2020 9.3 years 8.8 years 10.9 50.3 0.4 3.3 3.5% 4.7% Total lease payments 63.1 Less: Interest (7.1) Present value of lease liabilities 56.0 $ The future minimum rental payments summarized above exclude payments for lease liabilities held for sale. Maturity of Lease Liabilities Future minimum rental payments for leases with initial non-cancellable lease terms in excess of one year were as follows at March 31, 2021: Fiscal Year Operating Leases Finance Leases 2022 S 12.8 $ 0.6 2023 10.9 0.6 8.1 0.6 6.7 0.6 6.1 18.5 | 14.7 0.5 9.0 0.2 Table of Contents Note 17: Indebtedness Long-term debt consisted of the following: Term loans. Revolving credit facility 5.9% Senior Notes 5.8% Senior Notes Other (a) Less: current portion Less: unamortized debt issuance costs Total long-term debt Fiscal Year 2022 2023 2024 2025 2026 2027 and beyond Total. MODINE MANUFACTURING COMPANY NOTES TO CONSOLIDATED FINANCIAL STATEMENTS (In millions, except per share amounts) Fiscal year of maturity 2025 2025 2029 2027 $ 21.9 21.9 21.9 153.2 Table of Contents March 31, 2021 (a) Other long-term debt primarily includesfinance lease obligations and borrowings by foreign subsidiaries. Long-term debt matures as follows: 33.8 84.6 $337.3 $178.9 4.8 100.0 50.0 3.6 March 31, 2020 $189.4 127.2 100.0 50.0 6.0 472.6 (15.6) (5.0) $452.0 $ 337.3 (21.9) (4.2) $311.2 $ The Company maintains a credit agreement with a syndicate of banks that provides for a multi-currency $250.0 million revolving credit facility expiring in June 2024. In addition, this credit agreement provides for both U.S. dollar- and euro-denominated term loan facilities, with repayments continuing into fiscal 2025, and shorter-duration swingline loans. Borrowings under the revolving credit, swingline and term loan facilities bear interest at a variable rate, based upon the applicable reference rate and including a margin percentage dependent upon the Company's leverage ratio, as described below. At March 31, 2021, the weighted-average interest rates for these variable-rate borrowings was 2.5 percent. Based upon the terms of the credit agreement, the Company classifies borrowings under its revolving credit and swingline facilities as long-term and short-term debt, respectively, on its consolidated balance sheets. 73 At March 31, 2021, the Company's borrowings under its revolving credit and swingline facilities totaled $4.8 million and $1.4 million, respectively and domestic letters of credit totaled $5.7 million. As a result, available borrowing capacity under the Company's revolving credit facility was $238.1 million as of March 31, 2021. The Company also maintains credit agreements for its foreign subsidiaries. The $5.0 million of outstanding short-term borrowings related to these foreign at outstanding short horrowings at March 31, 2020 totaled $14.8 million see Note 2 for additional information on businesses held for sale. The Provisions in the Company's credit agreement, Senior Note agreements, and various foreign credit agreements require the Company to maintain compliance with various covenants and include certain cross-default clauses. Under its primary credit agreements in the U.S., the Company has provided liens on substantially all domestic assets. Also, as specified in the credit agreement, the term loans may require prepayments in the event of certain asset sales. In addition, at the time of each incremental borrowing under the revolving credit facility, the Company is required to represent to the lenders that there has been no material adverse effect, as defined in the credit agreement, on its business, property, of results of operations. MODINE MANUFACTURING COMPANY NOTES TO CONSOLIDATED FINANCIAL STATEMENTS (In millions, except per share amounts) In May 2020 and in response to risks and uncertainties introduced by the COVID-19 pandemic, the Company executed amendments to its primary credit agreements in the U.S. to provide additional financial covenant flexibility. The amendments temporarily raised the leverage ratio covenant limit during fiscal 2021 and 2022. In May 2021, based upon its outlook for fiscal 2022, the Company determined that such financial covenant flexibility was no longer necessary and amended the primary agreements. The May 2021 amendments reinstated the 3.25 to 1 leverage ratio covenant limit. The leverage ratio covenant requires the Company to limit the ratio of its consolidated indebtedness, less a portion of its cash balance, both as defined by the credit agreements, to its consolidated net earnings before interest, taxes, depreciation, amortization, and certain other adjustments ("Adjusted EBITDA"). The leverage ratio covenant limit for the fourth quarter of fiscal 2021 was 5.75 to 1. The Company is also subject to an interest expense coverage ratio covenant, which requires the Company to maintain Adjusted EBITDA of at least three times consolidated interest expense. As of March 31, 2021, the Company was in compliance with its debt covenants; its leverage ratio and interest coverage ratio were 1.9 and 9.3, respectively. = The Company estimates the fair value of long-term debt using discounted future cash flows at rates offered to the Company for similar debt instruments of comparable maturities. As of March 31, 2021 and 2020, the carrying value of the Company's long-term deb approximated fair value, with the exception of the Senior Notes, which had an aggregate fair value of approximately $146.0 million and $131.3 million, respectively. The fair value of the value measurements long-term debt is categorized as Level 2 within the fair value hierarchy. Refer to Note 4 for the definition of a Levl 2 fair Note 18: Pension and Employee Benefit Plans Defined Contribution Employee Benefit Plans The Company maintains a domestic 401(k) plan that allows employees to contribute a portion of their salary to help them save for retirement. The Company currently matches employee contributions up to 4.5 percent of their compensation. During fiscal 2021. as part of its response to the Postretirement Plans The Company provides selected healthcare and life insurance benefits for eligible retired domestic employees. The Company periodically amends these unfunded plans to change the contribution rate of retirees and the amounts and forms of coverage. An annual limit on the Company's cost is defined for the majority of these plans. The Company's net periodic income for its postretirement plans in each of fiscal 2021, 2020, and 2019 was $0.3 million. Measurement Date The Company uses March 31 as the measurement date for its pension and postretirement plans. Changes in benefit obligations and plan assets, as well as the funded status of the Company's global pension plans, were as follows: Years ended March 31, 2021 2020 Change in benefit obligation: Benefit obligation at beginning of year Service cost Interest cost Actuarial loss Benefits paid Curtailment gains (a) Effect of exchange rate changes. Benefit obligation at end of year Change in plan assets: Fair value of plan assets at beginning of year Actual return on plan assets i Benefits paid Employer contributions. Fair value of plan assets at end of year Funded status at end of year Amounts recognized in the consolidated balance sheets: Current liability Noncurrent liability Liabilities held for sale Table of Contents $ Costs for the Company's global pension plans included the following components: Components of net periodic benefit cost: Service cost Interest cost $ Expected return on plan assets Amortization of net actuarial loss Settlements (a) Net periodic benefit cost. $ $ 264.7 $ 0.4 Other changes in benefit obligation recognized in other comprehensive income (loss): Net actuarial gain (loss) Amortization of net actuarial loss Total recognized in other comprehensive income (loss) 7.9 2.7 (17.1) (0.1) 2.1 260.6 $ 131.1 $ 47.8 (17.1) 21.5 183.3 $ (77.3) (0.9) $ (58.6) (17.8) (77.3 $ (a) The curtailment gains in fiscal 2021 and 2020 are associated with headcount reductions in Europe within the Automotive segment. The Company recognizes curtallment gains as a component of net periodic benefit cost in the period headcount reductions occur. See Note 6 for additional information on the Company's restructuring activities. MODINE MANUFACTURING COMPANY NOTES TO CONSOLIDATED FINANCIAL STATEMENTS (In millions, except per share amounts) As of March 31, 2021, 2020, and 2019 the benefit obligation associated with the Company's non-U.S. pension plans totaled $36.4 million, $35.7 million, and $36.5 million respectively. The $0.7 million increase in the benefit obligation associated with non-U.S. pension plans as of March 31, 2021, compared with the prior year, was primarily due to a $2.2 million impact of foreign currency exchange rate changes and service and interest cost totaling $0.7 million, partially offsef by employer contributions of $2.2 million for benefits paid to plan participants during the year. In fiscal 2020, the $0.8 million decrease primarily resulted from employer contributions of $2.2 million for benefits paid to plan participants during the year, partially offset by service and interest cost totaling $0.9 million. The accumulated benefit obligation for pension plans was $258.9 million and $263.1 million as of March 31, 2021 and 2020 respectively. The net actuarial loss related to the pension plans recognized in accumulated other comprehensive loss was $151.1 million and $191.5 million as of March 31, 2021 and 2020, respectively. 2021 258.8 0.4 9.1 15.5 (18.2) (0.3 (0.6) 264.7 33.8 155.1 (11.6) (18.2) 5.8 131.1 (133.6) 7.1 40.9 (2.7) (130.9) (133.6) 0.4 7.9 (11.5) 6.9 0.2 3.9 Years ended March 31, 2020 S S 0.4 S 9.1 (12.0 6.0 0.2 3.7 S (38.7) 6.2 (325) S S 2019 0.5 9.6 (12.3) 5.6 0.2 3.6 (7.7) 5.8 (1.9) (a) The settlement charges resulted from activity associated with the Company's non-U.S. pension plans. The Company amortized $7.1 million, $6.2 million, and $5.6 million of net actuarial loss in fiscal 2021, 2020, and 2019, respectively. In each of these years, less than $1.0 million of the amortization was attributable to the Company's non-U.S. pension plans. The Company estimates $6.6 million of net actuarial loss for its pension plans will be amortized from accumulated other comprehensive loss into net periodic benefit cost during fiscal 2022. The fiscal 2022 estimated amortization includes less than $1.0 million related to the Company's non-U.S. pension plans. In addition, the Company expects to recognize approximately $7.0 million of net actuarial losses in fiscal 2022 as part of the anticipated losses to be recorded upon sale of the liquid- and air-cooled automotive businesses. The Company used a discount rate of 3.2% and 3.4% as of March 31, 2021 and 2020, respectively, for determining its benefit obligations under its U.S. pension plans. The Company used a weighted-average discount rate of 1.0% as of both March 31, 2021 and 2020, respectively, for determining its benefit obligations under its non-U.S. pension plans. The Company used a discount rate of 3.4%, 4.0 %, and 4.0% to determine its costs under its U.S. pension plans for fiscal 2021, 2020, and 2019, respectively. The Company used a weighted-average discount rate of 1.4%, 1.7%, and 1.9% to determine its costs under its non-U.S. pension plans for fiscal 2021, 2020, and 2019, respectively. The Company determined the discount rates used for its U.S. pension plans by modeling a portfolio of high-quality corporate bonds, with appropriate consideration given to expected defined benefit payment. terms and duration of the respective pension obligations. The Company used a similar process to determine the discount rate for its non-U.S. pension obligations. The Company used a discount rate of 3.2% and 3.4% as of March 31, 2021 and 2020, respectively, for determining its benefit obligations under its U.S. pension plans. The Company used a weighted-average discount rate of 1.0% as of both March 31, 2021 and 2020, respectively, for determining its benefit obligations under its non-U.S. pension plans. The Company used a discount rate of 3.4%, 4.0 %, and 4.0% to determine its costs under its U.S. pension plans for fiscal 2021, 2020, and 2019, respectively. The Company used a weighted-average discount rate of 1.4%, 1.7%, and 1.9% to determine its costs under its non-U.S. pension plans for fiscal 2021, 2020, and 2019, respectively. The Company determined the discount rates used for its U.S. pension plans by modeling a portfolio of high-quality corporate bonds, with appropriate consideration given to expected defined benefit payment terms and duration of the respective pension obligations. The Company used a similar process to determine the discount rate for its non-U.S. pension obligations. Plan assets in the Company's U.S. pension plans comprise 100 percent of the Company's world-wide pension plan assets. The Company's U.S. pension plan weighted-average asset allocations at the measurement dates of March 31, 2021 and 2020 were as follows: Equity securities Debt securities Real estate investments Cash and cash equivalents Table of Contents March 31, 2021 Plan assets 73% 17% Target allocation Due to market conditions and other factors, including timing of benefit payments and othe transactions, actual asset allocation may vary fro the target allocation outlined above. The Company periodically rebalances the assets to the target allocations. As of March 31, 2021 and 2020, the Company's pension plans did not directly own shares of Modine common stock. Fiscal Year 2022 2023 2024 2025 2026 2027-2031 76% 18% 5% 1% 100% 76 The Company employs a total return investment approach, whereby a mix of investments are used to maximize the long-term growth of principal, while avoiding excessive risk. The Company has established pension plan guidelines based upon an evaluation of market conditions, tolerance for risk and cash requirements for benefit payments. The Company measures and monitors investment risk on an ongoing basis through quarterly investment portfolio reviews, annual liability measurements and periodic asset/liability studies. Table of Contents 9% 1% 100% MODINE MANUFACTURING COMPANY NOTES TO CONSOLIDATED FINANCIAL STATEMENTS (In millions, except per share amounts) The expected rate of return on U.S. plan assets is based upon historical return experience and forward-looking return expectations for major asset class categories. For fiscal 2021, 2020, and 2019 U.S. pension plan expense, the expected rate of return on plan assets was 7.5 percent. For fiscal 2022 U.S. pension plan expense, the Company has assumed a rate of return on plan assets of 7.5 percent. 15.2 15.5 15.6 15.6 March 31, 2020 Target allocation Plan assets 65% 60% 21% 22% 13% 16% 1% 20% 100% 100% The Company's funding policy for its U.S. pension plans is to contribute annually, at a minimum, the amount necessary on an actuarial basis to provide for benefits in accordance with applicable laws and regulations. The Company expects to contribute approximately $13.0 million to its U.S. plans during fiscal 2022. 15.5 74.6 Estimated pension benefit payments, excluding payments for pension liabilities held for sale, for the next ten fiscal years are as follows: Estimated Pension Benefit Payments Note 19: Derivative Instruments The Company uses derivative financial instruments from time to time as a tool to manage certain financial risks. The Company's policy prohibits the use of leveraged derivatives. Accounting for derivatives and hedging activities requires derivative financial instruments to be measured at fair value and recognized as assets or liabilities in the consolidated balance sheets. Accounting for the gain or loss resulting from the change in fair value of the derivative financial instruments depends on whether it has been designated as a hedge, and, if so, on the nature of the hedging activity. Commodity Derivatives The Company periodically enters into over-the-counter forward contracts related to forecasted purchases of aluminum and copper. The Company's strategy in entering into these contracts is to reduce its exposure to changing market prices of these commodities. The Company designates certain commodity forward contracts as cash flow hedges for accounting purposes. Accordingly, for these designated hedges, the Company records unrealized gains and losses related to the change in the fair value of the contracts in accumulated other comprehensive income (loss) ("AOCI") within shareholders' equity and subsequently recognizes the gains and losses within cost of sales as the underlying inventory is sold. Foreign Exchange Contracts The Company's foreign exchange risk management strategy uses derivative financial instruments to mitigate foreign currency exchange risk. The Company periodically enters into foreign currency forward contracts to hedge specific foreign currency-denominated assets and liabilities as well as forecasted transactions. The Company designates certain hedges of forecasted transactions as cash flow hedges for accounting purposes. Accordingly, for these designated hedges, the Company records unrealized gains and losses related to the change in the fair value of the contracts in AOCI within shareholders equity and subsequently recognizes the gains and losses as a component of earnings at the same time and in the same transactions impact earnings. The Company has not designated forward contracts related to foreign currency-denominated assets and financial statement line that the as hedges. Accordingly, for these non-designated contracts, the Company records unrealized gains and losses related to changes in fair value in other income and expens. Gains and losses on these foreign currency contracts are offset by foreign currency gains and losses associated with the related assets and liabilities. 77 Table of Contents The fair value of the Company's derivative financial instruments recorded in the consolidated balance sheets were as follows: Balance Sheet Location March 31, 2021 March 31, 2020 0.5 0.1 Derivatives designated as hedges: Commodity derivatives Commodity derivatives Foreign exchange contracts. Derivatives not designated as hedges: Foreign exchange contracts Commodity derivatives Foreign exchange contracts. Foreign exchange contracts Total gains (losses) Other current liabilities $ S The amounts associated with derivative financial instruments that the Company designated for hedge accounting during the years ended March 31 were as follows: $ 2021 Table of Contents MODINE MANUFACTURING COMPANY NOTES TO CONSOLIDATED FINANCIAL STATEMENTS (In millions, except per share amounts) 2.2 Gain (loss) recognized in other comprehensive income 2020 - Other current assets Other current liabilities Other current assets. (0.1) (2.6) $ (0.1 0.2 (2.5) 2019 Foreign exchange contracts Foreign exchange contracts Total gains (losses) Note 20: Risks, Uncertainties, Contingencies and Litigation, (0.3) Cost of sales (0.4) Net sales Statement of Operations Location 1.0 Cost of sales 0.3 Statement of Operations Location Net sales Other income (expense) - net 78 $ 2021 $ The amounts associated with derivative financial instruments that the Company did not designate for hedge accounting were as follows: Years ended March 31, 2020 (0.1) $ (0.1) (0.2) $ 0.6 0.6 $ 2021 MODINE MANUFACTURING COMPANY NOTES TO CONSOLIDATED FINANCIAL STATEMENTS (In millions, except per share amounts) S (0.1 (0.1 Gain (loss) reclassified from AOCI 2020 1.3 0.1 2019 (0.7) (0.3) (1.0) (0.8) $ (0.1) 0.4 (0.5) $ COVID-19 In March 2020, the World Health Organization declared the outbreak of the novel coronavirus, COVID-19, a pandemic. The spread of COVID-19 and the resulting work and travel restrictions, including international border closings have disrupted, and may continue to disrupt, global supply chains and have negatively impacted the global economy. As a result of this pandemic, the Company experienced significant impacts on its operations Local government requirements of customer shutdowns caused the Company to suspend production at many of its manufacturing facilities in March and April 2020. All of the temporarily-closed facilities reopened in the first or second quarter of fiscal 2021 and have generally returned to more normal production levels. However, since reopening, production at certain of our plants has been negatively affected at times by employee absences due to COVID-19. The Company is continuing to focus on protecting the health and wellbeing of its employees and the communities in which it operates, while also ensuring the continuity of its business operations and timely delivery of quality products and services to its customers. Beginning largely in April 2020 and to mitigate the negative impacts of COVID-19, the Company took actions including, but not limited to, production staffing adjustmnts, furloughs, shortened work weeks, and temporary salary reductions at all levels of the organization. While the Company withdrew most of the cost-saving actions in the third quarter of fiscal 2021 as production returned to more normal levels as markets recovered, it remains focused on controlling operating and administrative expenses 2019 (0.4) (0.4) 0.6 (0.2 The Company's consolidated financial statements reflect estimates and assumptions made by management, including assumptions regarding the future impacts of the COVID-19 pandemic, that affect the reported amounts of assets and liabilities and disclosure of contingent assets and liabilities. at the date of the consolidated financial statements and reported amounts of revenue and expenses during the reporting periods presented. For example, the Company's goodwill impairment review is particularly sensitive to assumptions that could be adversely impacted by the COVID-19 pandmic. While the Company believes it used appropriate estimates and assumptions to prepare the consolidated financial statements, actual amounts could differ materially and future events or circumstances could have a potential negative effect on the assumptions used. If the Company, its suppliers, or its customers experience further shutdowns or other significant business disruptions associated with the COVID-19 pandemic, its ability to conduct business in the manner and on the timelines presently planned could be materially and negatively impacted, which could have a material adverse effect on the Company's business, financial position, rsults of operations and cash flows. Market Risk The Company sells a broad range of products that provide thermal solutions to customers operating in diverse markets, including commercial, industrial, and building HVAC&R markets and vehicular markets, including commercial vehicle, off-highway and automotive and light vehicle. The COVID-19 pandemic negatively impacted many of these markets; while we expect the markets will continue to recover, risk and uncertainties remain present. Credit Risk The Company invests excess cash primarily in investment quality, short-term liquid debt instruments. Financial instruments that potentially subject the Company to significant concentrations of credit risk consist principally of accounts receivable The Company sells a broad range of products that provide thermal solutions to customers operating throughout the world. In fiscal 2021 and 2020, one vehicular customer accounted for more than ten percent of the Company's total sales. In fiscal 2019, two vehicular customers each accounted for ten percent or more of the Company's total sales. Sales to the Company's top ten customers were 43 percent, 45 percent, and 50 percent of total sales in fiscal 2021, 2020, and 2019, respectively. At March 31, 2021 and 2020, 35 percent and 34 percent, respectively, of the Company's trade accounts receivable were due from the Company's top ten customers. These customers operate primarily in the automotive, commercial vehicle, off-highway, data center cooling and commercial air conditioning markets. The Company generally does not require collateral or advanced payments from its customers. The Company has not experienced significant credit losses to customers in the markets served nor has experienced a significant increase in credit losses in connection with the COVID-19 pandemic. History Modine was incorporated under the laws of the State of Wisconsin on June 23, 1916 by its founder, Arthur B. Modine. Mr. Modine's "Turbotube" radiators became Standard equipment on the famous Ford Motor Company Model T. When he died at the age of 95, A.B. Modine had personally been granted more than 120 U.S. patents for his heat transfer innovations. The standard of innovation exemplified by A.B. Modine remains the cornerstone of Modine today. Terms and Year References When we use the terms "Modine," "we," "us," the "Company" or "our" in this report, unless the context otherwise requires, we are referring to Modine Manufacturing Company Our fiscal year ends on March 31 and, accordingly, all references to a particular year mean the fiscal year ended March 31 of that year, unless indicated otherwise. Business Strategy and Results We thrive on innovation and use our thermal management expertise to design products that better the world. From improving indoor air quality to increasing energy efficiency of data centers to lowering harmful vehicular emissions, our businesses design quality systems and products to enable our customers to operate in the ever-changing global marketplace. Fiscal 2021 presented challenges, largely driven by the COVID-19 pandemic. Since the onset of the pandemic, our top priorities have been, and continue to be, the health and overall well-being of our employees and delivering quality products and services to our customers. COVID-19 has broadly impacted the global economy and our Key end markets. Our businesses were most severely impacted during the first quarter of fiscal 2021. In response, we swiftly implemented cost-saving actions, including, but not limited to, production staffing adjustments, furloughs, shortened work weeks, and temporary salary reductions at all levels of our organization. We withdrew most of these cost-saving actions in the third quarter of fiscal 2021 as production returned to more normal levels as markets recovered. 1 Table of Contents Despite the challenges, we ended the year in a position of strength. By the end of fiscal 2021, we had reached agreements to sell both the liquid- and air-cooled automotive businesses in sparate transactions. These sale agreements represent significant progress towards our strategic exit of our Automotive segment businesses. The sale of the air-cooled automotive business closed in April 2021. The sale of the liquid-cooled automotive business is subject to the receipt of governmental and third-party approvals and satisfaction of other closing conditions. We are currently working with the buyer through the regulatory approval process. At this time, we are not able to estimate the ultimate impact of the regulatory approval process or the closing date for this transaction. We also completed the transition to our new President and Chief Executive Officer ("CEO"), Neil D. Brinker. Under Mr. Brinker's leadership, our teams are energized in implementing an 80/20 strategy to examine our business using data analytics in order to focus our resources on products and markets with the highest growth and best returns. During fiscal 2021, our consolidated net sales were $1.81 billion, an 8 percent decrease from $1.98 billion in fiscal 2020. This decrease was primarily due to lower sales in our Commercial and Industrial Solutions ("CIS") Heavy-Duty Equipment ("HDE"), and Automotive segments, largely driven by impacts of the COVID-19 pandemic. Our Building HVAC Systems ("BHVAC") segment sales increased 9 percent compared with the prior year. Our operating loss of $98 million in fiscal 2021 was primarily due to $167 million of impairment charges recorded in the Automotive segment, partially offset by lower selling, general and administrative ("SG&A") expenses, which benefitted from lower project costs associated with our stratgic exit of the automotive businesses and cost-reduction initiatives in response to COVID-19. Our top five customers are in the commercial vehicle, off-highway and automotive and light vehicle markets and our ten largest customers accounted for 43 percent of our fiscal 2021 sales. In fiscal 2021, 63 percent of our total sales were generated from customers outside of the U.S., with 56 5 percent of total sales generated by foreign operations and 7 percent generated by exports from the U.S. In fiscal 2020, 59 percent of our total sales were generated from customers outside of the U.S., with 52 percent of total sales generated by foreign operations and 7 percent generated by exports from the U.S. In fiscal 2019, 58 percent of our total sales were generated from customers outside of the U.S., with 52 percent of total sales generated by foreign operations and 6 percent generated by exports from the U.S. Markets We sell products to multiple end markets. The following is a summary of our primary end markets, categorized as a percentage of our net sales: Fiscal 2021 Fiscal 2020 33% 32% 25% 26% Commercial HVAC&R Automotive Commercial vehicle Off-highway Data center cooling Industrial cooling Other 15% 15% 6% 3% 3% 16% 13% 8% 2% 3% Competitive Position We compete with many manufacturers of heat transfer and HVAC&R products, some of which are divisions of larger companies. The markets for our products continue to be very dynamic. Our traditional OEM customers are faced with dramatically increased international competition and have expanded their global manufacturing footprints to compete in local markets. In addition, consolidation within the supply base and vertical integration have introduced new or festructured comptitors to our markets. Some of these market changes have caused us to experience competition from suppliers in other parts of the world that enjoy economic advantages such as lower labor costs, lower healthcare costs, and lower tax rates. As a result, we continue to optimize our geographic footprint to provide more flexibility to serve our customers around the globe. Many of our customers also continue to ask us, as well as their other primary suppliers, to provide research and development ("R&D"), design, and validation support for new potential projects. This combined work effort often results in stronger customer relationships and more partnership opportunities for us. Table of Contents Business Segments Each of our operating segments is managed by a vice president and has separate financial results reviewed by our chief operating decision maker ("CODM.") These results are used by management in evaluating the performance of each business segment and in making decisions on the allocation of resources amongst our various businesses. Financial information for our operating segments is included in Note 22 of the Notes to Consolidated Financial Statements. Effective April 1, 2020, we began managing our automotive business separate from the previously-reported Vehicular Thermal Solutions ("VTS") segment. The other businesses of the VTS segment, including the commercial vehicle and off-highway businesses, are being managed as the HDE segment. Our Industrial Businesses Building HVAC Systems Segment Market Overview In North America, the heating market experienced modest growth in fiscal 2021. The ventilation markets, driven by new construction and renovations, were negatively impacted by COVID-19, especially within the hospitality sectors. In fiscal 2022, we expect continued modest growth in the North American heating markets. We also expect strong growth in the North American ventilation markets, largely driven by an increased focus on and available federal and local funding for ventilation improvements by school and healthcare systems as a result of the COVID-19 pandemic. 11. What information is contained in the Statement of Cash Flows (SCF) that can help investors, creditors, and others? 2. Which activities are included in the operation activities in the SCF? 3. Which method, the indirect method or the direct method, is used to prepare the SCF?
Step by Step Solution
3.47 Rating (176 Votes )
There are 3 Steps involved in it
Step: 1
Step 12 A complete statement that includes all the information r...
See step-by-step solutions with expert insights and AI powered tools for academic success
Step: 2

Step: 3

Ace Your Homework with AI
Get the answers you need in no time with our AI-driven, step-by-step assistance
Get Started


