how do i answer
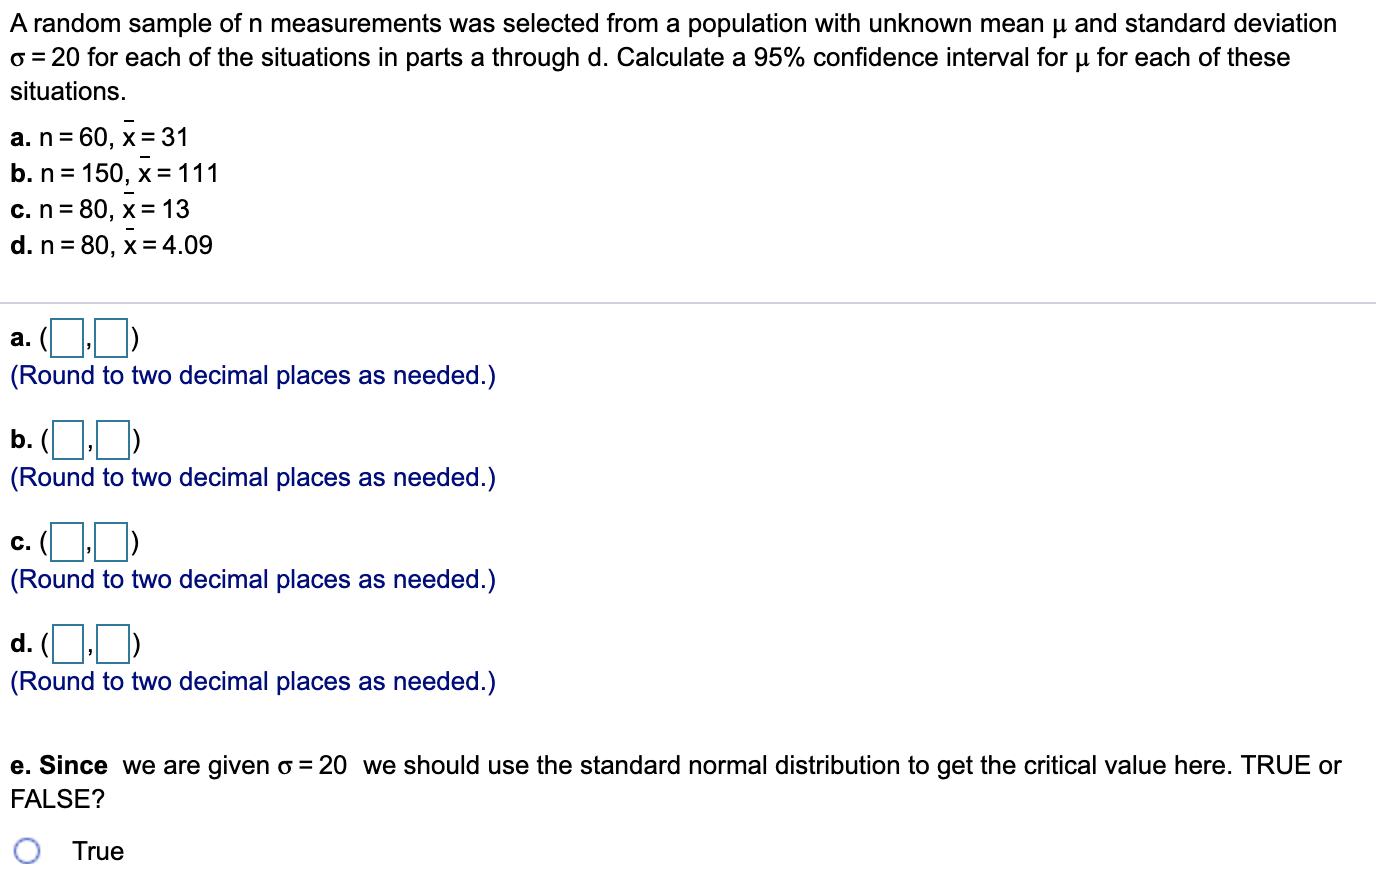
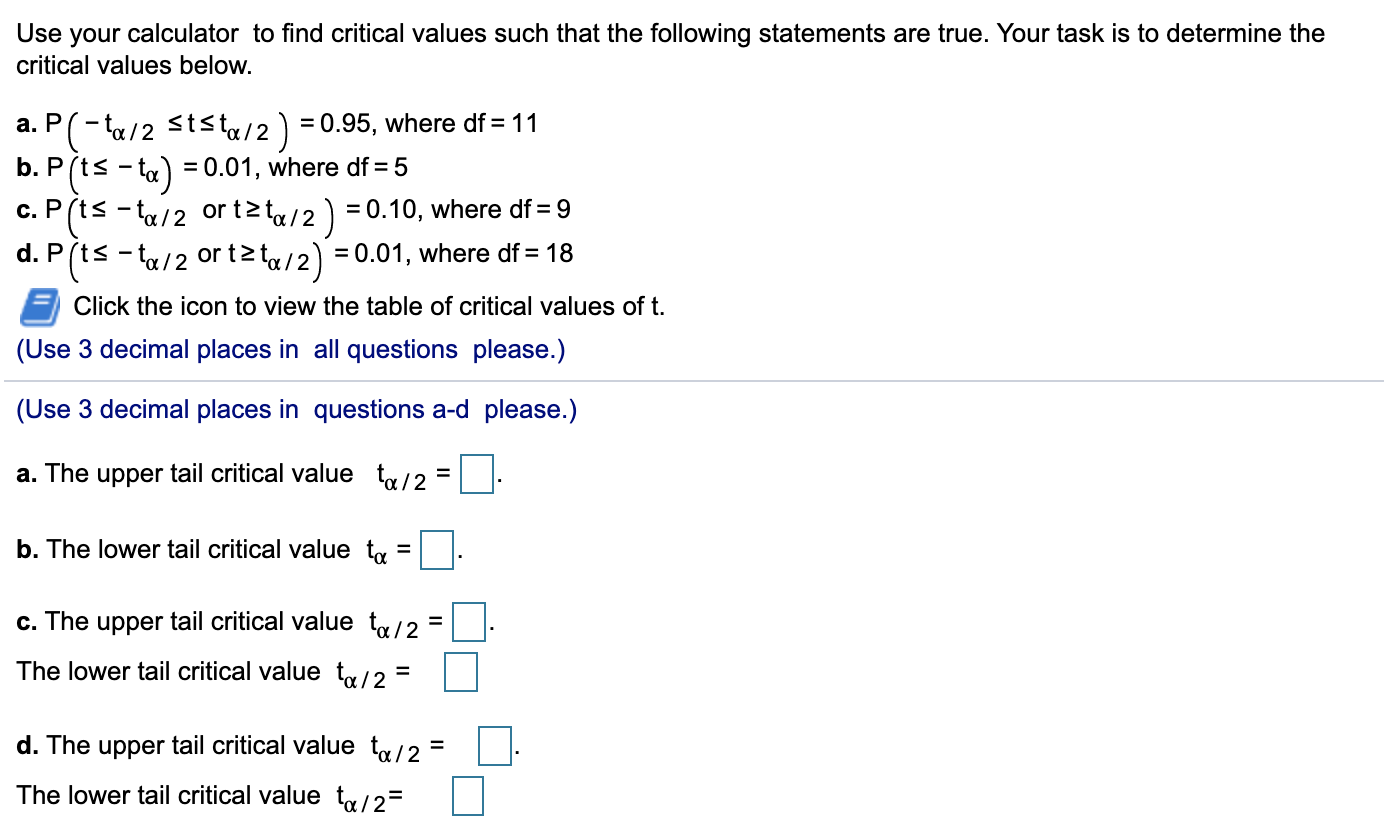
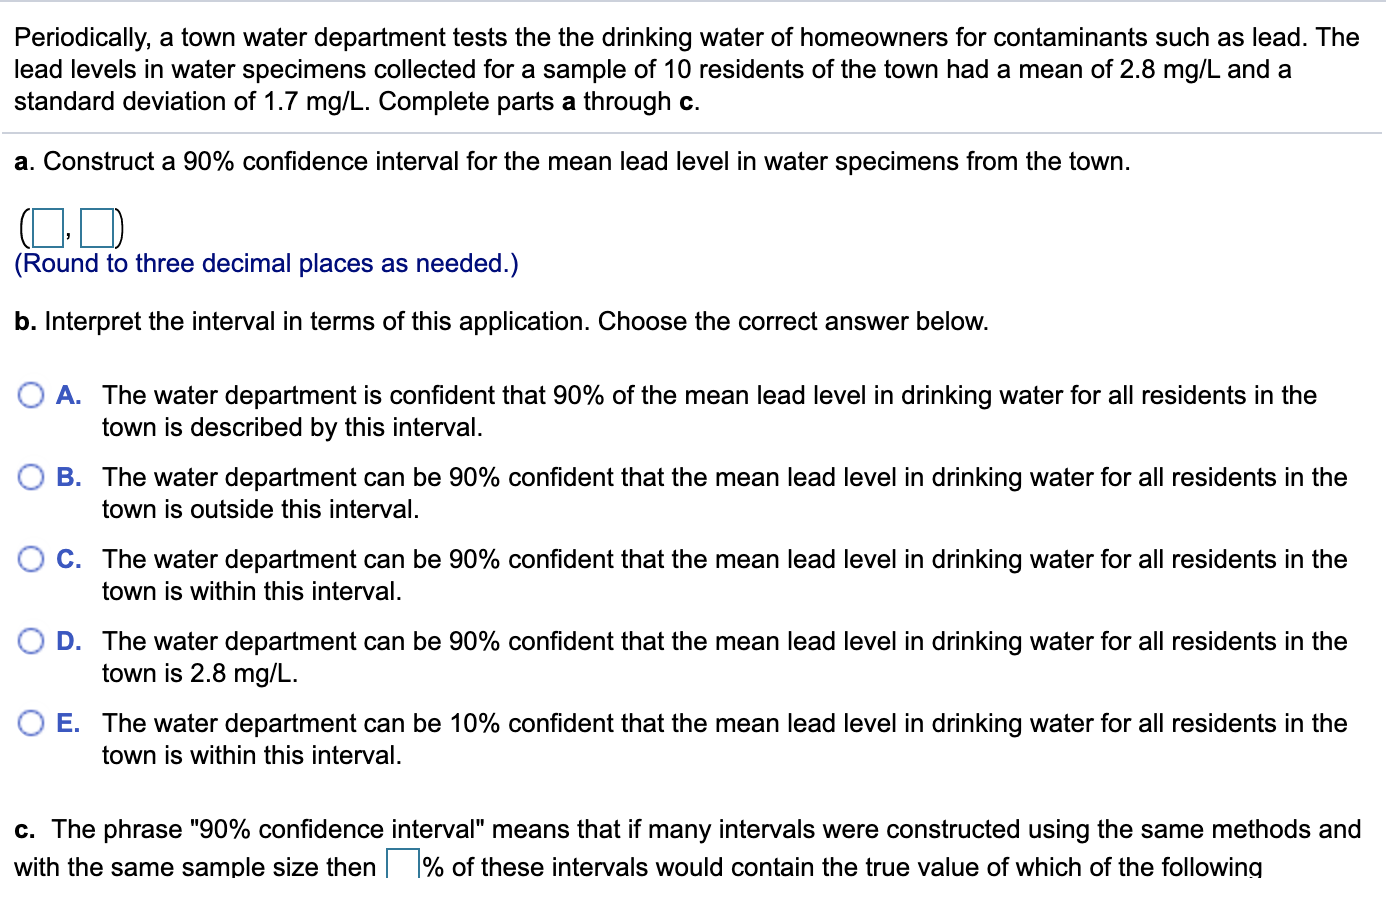
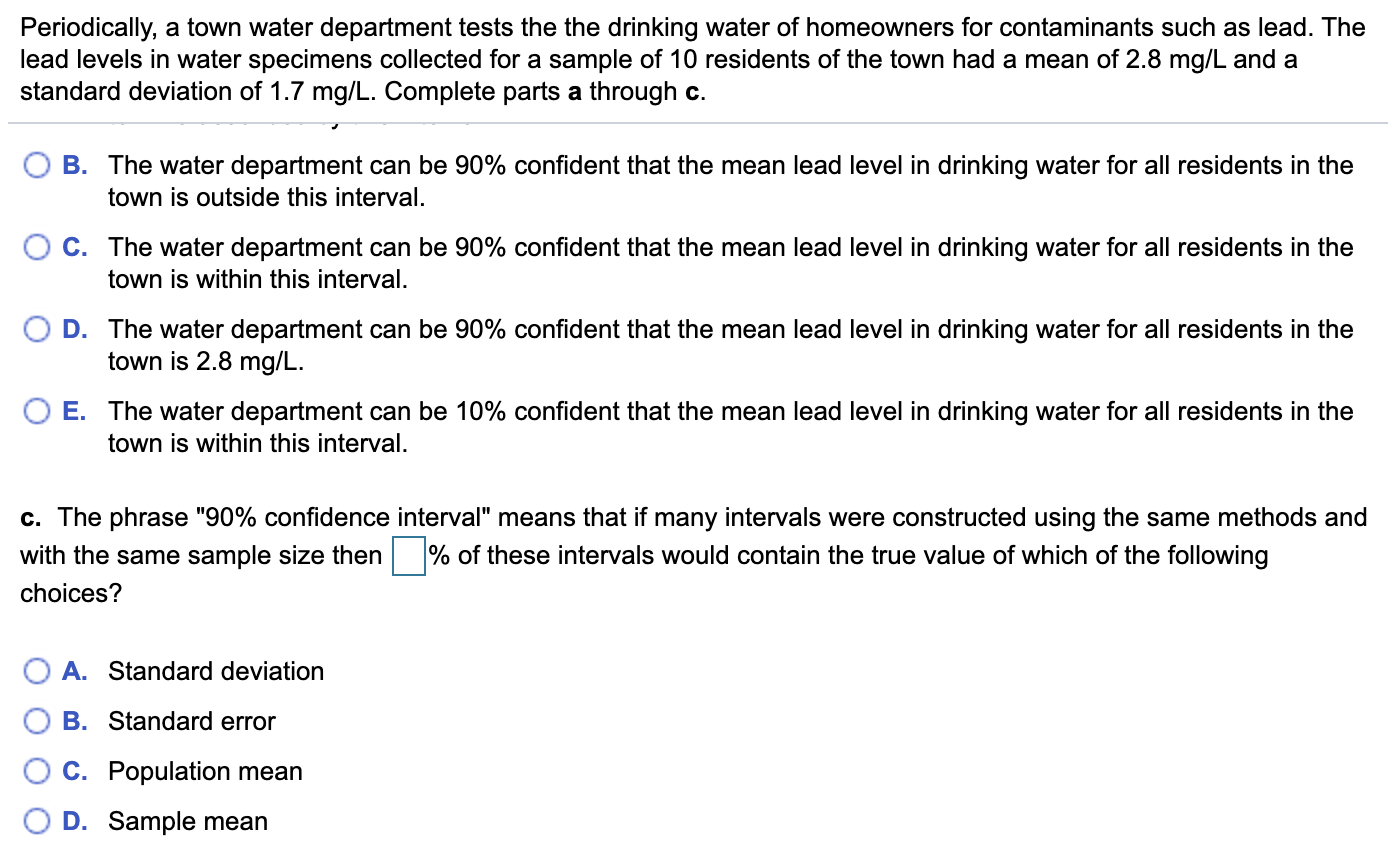
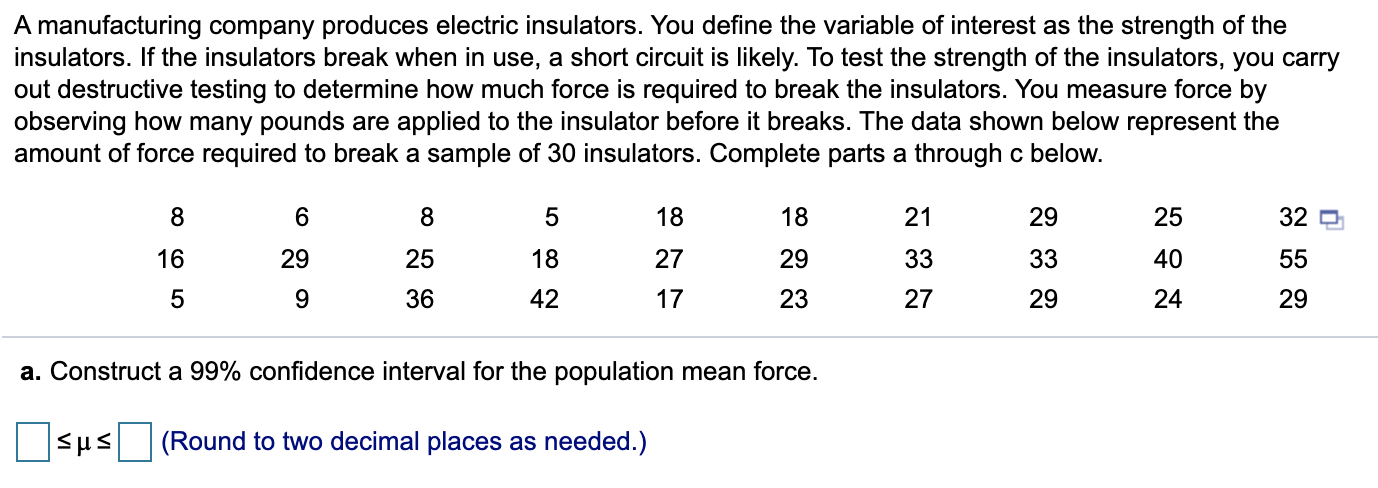
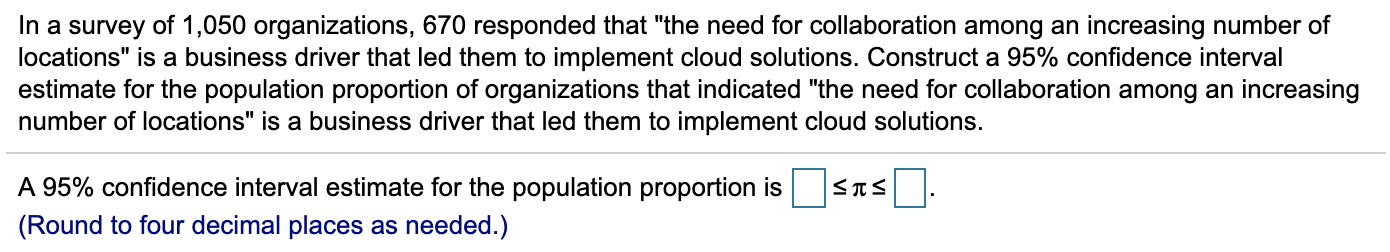
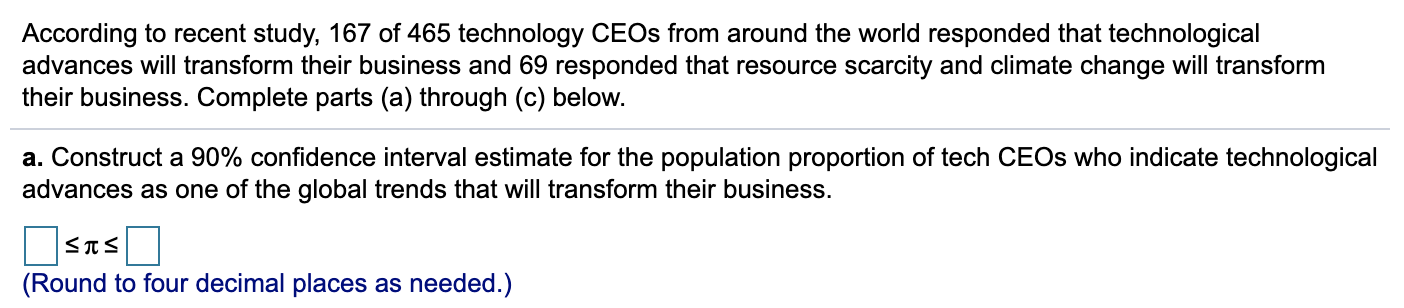
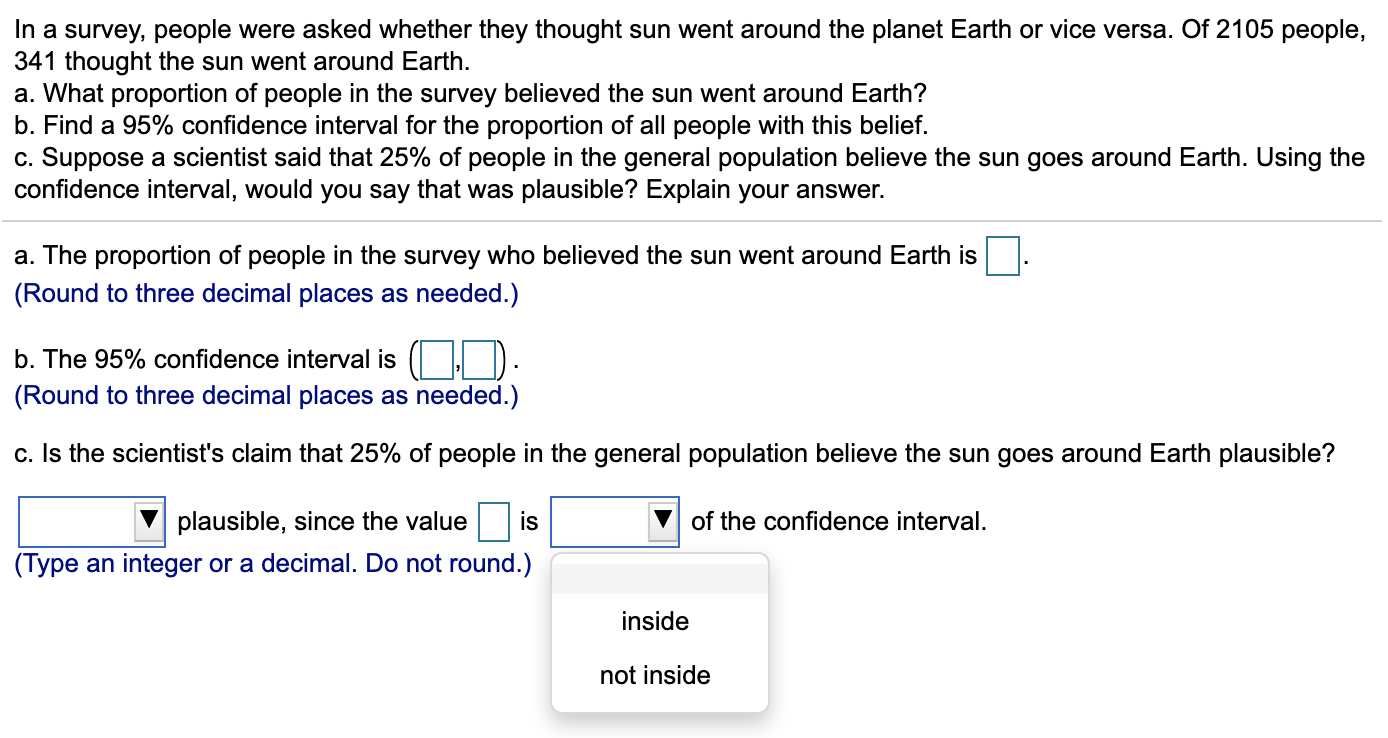
A random sample of n measurements was selected from a population with unknown mean u and standard deviation o = 20 for each of the situations in parts a through d. Calculate a 95% confidence interval for u for each of these situations. a. n = 60, x = 31 b. n = 150, x = 111 c. n = 80, x = 13 d. n = 80, x = 4.09 a. (L (Round to two decimal places as needed.) b. ( (Round to two decimal places as needed.) C.( (Round to two decimal places as needed.) d. ( (Round to two decimal places as needed.) e. Since we are given o = 20 we should use the standard normal distribution to get the critical value here. TRUE or FALSE? O TrueUse your calculator to find critical values such that the following statements are true. Your task is to determine the critical values below. a. P( -ta/2 ststa/2 ) =0.95, where df = 11 b. P (ts - to) = 0.01, where df = 5 c. P (ts - ta/2 ort2ta/2 ) =0.10, where df = 9 d. P (ts -ta/2 or tzto/2) =0.01, where df = 18 Click the icon to view the table of critical values of t. (Use 3 decimal places in all questions please.) (Use 3 decimal places in questions a-d please.) a. The upper tail critical value to/2 = b. The lower tail critical value to = c. The upper tail critical value to /2 = The lower tail critical value to/2 = d. The upper tail critical value to/2 = The lower tail critical value to / 2=Periodically, a town water department tests the the drinking water of homeowners for contaminants such as lead. The lead levels in water specimens collected for a sample of 10 residents of the town had a mean of 2.8 mglL and a standard deviation of 1.7 mglL. Complete parts a through c. a. Construct a 90% condence interval for the mean lead level in water specimens from the town. (D D) (Round to three decimal places as needed.) b. Interpret the interval in terms of this application. Choose the correct answer below. 0 A. The water department is condent that 90% of the mean lead level in drinking water for all residents in the town is described by this interval. 0 B. The water department can be 90% condent that the mean lead level in drinking water for all residents in the town is outside this interval. 0 C. The water department can be 90% condent that the mean lead level in drinking water for all residents in the town is within this interval. 0 D. The water department can be 90% condent that the mean lead level in drinking water for all residents in the town is 2.8 mgIL. O E. The water department can be 10% condent that the mean lead level in drinking water for all residents in the town is within this interval. 6. The phrase "90% condence interval" means that if many intervals were constructed using the same methods and with the same sample size then lI% of these intervals would contain the true value of which of the following Periodically, a town water department tests the the drinking water of homeowners for contaminants such as lead. The lead levels in water specimens collected for a sample of 10 residents of the town had a mean of 2.8 mglL and a standard deviation of 1.7 mglL. Complete parts a through c. J O B. The water department can be 90% condent that the mean lead level in drinking water for all residents in the town is outside this interval. 0 C. The water department can be 90% condent that the mean lead level in drinking water for all residents in the town is within this interval. 0 D. The water department can be 90% condent that the mean lead level in drinking water for all residents in the town is 2.8 mgIL. O E. The water department can be 10% condent that the mean lead level in drinking water for all residents in the town is within this interval. c. The phrase "90% condence interval" means that if many intervals were constructed using the same methods and with the same sample size then D? of these intervals would contain the true value of which of the following choices? 0 A. Standard deviation 0 B. Standard error 0 0. Population mean 0 D. Sample mean A manufacturing company produces electric insulators. You define the variable of interest as the strength of the insulators. If the insulators break when in use, a short circuit is likely. To test the strength of the insulators, you carry out destructive testing to determine how much force is required to break the insulators. You measure force by observing how many pounds are applied to the insulator before it breaks. The data shown below represent the amount of force required to break a sample of 30 insulators. Complete parts a through c below. 8 6 8 5 18 18 21 29 25 32 0 16 29 25 18 27 29 33 33 40 55 5 9 36 42 17 23 27 29 24 29 a. Construct a 99% confidence interval for the population mean force. SUS (Round to two decimal places as needed.)In a survey of 1,050 organizations, 670 responded that "the need for collaboration among an increasing number of locations" is a business driver that led them to implement cloud solutions. Construct a 95% condence interval estimate for the population proportion of organizations that indicated "the need for collaboration among an increasing number of locations" is a business driver that led them to implement cloud solutions. A 95% condence interval estimate for the population proportion is D s 11: s D. (Round to four decimal places as needed.) According to recent study, 167 of 465 technology CEOs from around the world responded that technological advances will transform their business and 69 responded that resource scarcity and climate change will transform their business. Complete parts (a) through (c) below. a. Construct a 90% condence interval estimate for the population proportion of tech CEOs who indicate technological advances as one of the global trends that will transform their business. DSuSD (Round to four decimal places as needed.) In a survey, people were asked whether they thought sun went around the planet Earth or vice versa. Of 2105 people, 341 thought the sun went around Earth. a. What proportion of people in the survey believed the sun went around Earth? b. Find a 95% confidence interval for the proportion of all people with this belief. c. Suppose a scientist said that 25% of people in the general population believe the sun goes around Earth. Using the confidence interval, would you say that was plausible? Explain your answer. a. The proportion of people in the survey who believed the sun went around Earth is (Round to three decimal places as needed.) b. The 95% confidence interval is (Round to three decimal places as needed.) c. Is the scientist's claim that 25% of people in the general population believe the sun goes around Earth plausible? plausible, since the value is of the confidence interval. (Type an integer or a decimal. Do not round.) inside not insideIn a survey, people were asked whether they thought sun went around the planet Earth or vice versa. Of 2105 people, 341 thought the sun went around Earth. a. What proportion of people in the survey believed the sun went around Earth? b. Find a 95% confidence interval for the proportion of all people with this belief. c. Suppose a scientist said that 25% of people in the general population believe the sun goes around Earth. Using the confidence interval, would you say that was plausible? Explain your answer. a. The proportion of people in the survey who believed the sun went around Earth is (Round to three decimal places as needed.) b. The 95% confidence interval is (Round to three decimal places as needed.) c. Is the scientist's claim that 25% of people in the general population believe the sun goes around Earth plausible? plausible, since the value is of the confidence interval. decimal. Do not round.) Yes, it is No, it is notYou are given the sample mean and the population standard deviation. Use this information to construct the 90% and 95% confidence intervals for the population mean. Interpret the results and compare the widths of the confidence intervals. If convenient, use technology to construct the confidence intervals. A random sample of 40 home theater systems has a mean price of $134.00. Assume the population standard deviation is $15.10. Construct a 90% confidence interval for the population mean. The 90% confidence interval is ( (Round to two decimal places as needed.) Construct a 95% confidence interval for the population mean. The 95% confidence interval is ( (Round to two decimal places as needed.) Interpret the results. Choose the correct answer below. O A. With 90% confidence, it can be said that the population mean price lies in the first interval. With 95% confidence, it can be said that the population mean price lies in the second interval. The 95% confidence interval is wider than the 90%. O B. With 90% confidence, it can be said that the population mean price lies in the first interval. With 95% confidence, it can be said that the population mean price lies in the second interval. The 95% confidence interval is narrower than the 90%.You are given the sample mean and the population standard deviation. Use this information to construct the 90% and 95% confidence intervals for the population mean. Interpret the results and compare the widths of the confidence intervals. If convenient, use technology to construct the confidence intervals. A random sample of 40 home theater systems has a mean price of $134.00. Assume the population standard deviation is $15.10. The 90% confidence interval is( , ). (Round to two decimal places as needed.) Construct a 95% confidence interval for the population mean. The 95% confidence interval is ( (Round to two decimal places as needed.) Interpret the results. Choose the correct answer below. O A. With 90% confidence, it can be said that the population mean price lies in the first interval. With 95% confidence, it can be said that the population mean price lies in the second interval. The 95% confidence interval is wider than the 90%. O B. With 90% confidence, it can be said that the population mean price lies in the first interval. With 95% confidence, it can be said that the population mean price lies in the second interval. The 95% confidence interval is narrower than the 90%. O C. With 90% confidence, it can be said that the sample mean price lies in the first interval. With 95% confidence, it can be said that the sample mean price lies in the second interval. The 95% confidence interval is wider than the 90%.You are given the sample mean and the population standard deviation. Use this information to construct the 90% and 95% confidence intervals for the population mean. Interpret the results and compare the widths of the confidence intervals. From a random sample of 44 business days, the mean closing price of a certain stock was $119.86. Assume the population standard deviation is $10.22. The 90% confidence interval is (,). (Round to two decimal places as needed.) The 95% confidence interval is (,). (Round to two decimal places as needed.) Which interval is wider? Choose the correct answer below. O The 95% confidence interval O The 90% confidence interval Interpret the results. O A. You can be certain that the population mean price of the stock is either between the lower bounds of the 90% and 95% confidence intervals or the upper bounds of the 90% and 95% confidence intervals. O B. You can be certain that the closing price of the stock was within the 90% confidence interval for approximately 40 of the 44 days, and was within the 95% confidence interval for approximately 42 of the 44 days.You are given the sample mean and the population standard deviation. Use this information to construct the 90% and 95% confidence intervals for the population mean. Interpret the results and compare the widths of the confidence intervals. From a random sample of 44 business days, the mean closing price of a certain stock was $119.86. Assume the population standard deviation is $10.22. Which interval is wider? Choose the correct answer below. O The 95% confidence interval O The 90% confidence interval Interpret the results. O A. You can be certain that the population mean price of the stock is either between the lower bounds of the 90% and 95% confidence intervals or the upper bounds of the 90% and 95% confidence intervals. O B. You can be certain that the closing price of the stock was within the 90% confidence interval for approximately 40 of the 44 days, and was within the 95% confidence interval for approximately 42 of the 44 days. O C. You can be 90% confident that the population mean price of the stock is between the bounds of the 90% confidence interval, and 95% confident for the 95% interval. O D. You can be 90% confident that the population mean price of the stock is outside the bounds of the 90% confidence interval, and 95% confident for the 95% interval.You are given the sample mean and the population standard deviation. Use this information to construct the 90% and 95% confidence intervals for the population mean. Interpret the results and compare the widths of the confidence intervals. From a random sample of 63 dates, the mean record high daily temperature in a certain city has a mean of 84.51 F. Assume the population standard deviation is 13.55 F. The 90% confidence interval is ( (Round to two decimal places as needed.) The 95% confidence interval is (,). (Round to two decimal places as needed.) Which interval is wider? Choose the correct answer below. O The 90% confidence interval O The 95% confidence interval Interpret the results. O A. You can be certain that the mean record high temperature was within the 90% confidence interval for approximately 57 of the 63 days, and was within the 95% confidence interval for approximately 60 of the 63 days. O B. You can be certain that the population mean record high temperature is either between the lower bounds of the 90% and 95% confidence intervals or the upper bounds of the 90% and 95% confidence intervals.You are given the sample mean and the population standard deviation. Use this information to construct the 90% and 95% confidence intervals for the population mean. Interpret the results and compare the widths of the confidence intervals. From a random sample of 63 dates, the mean record high daily temperature in a certain city has a mean of 84.51 F. Assume the population standard deviation is 13.55 F. Which interval is wider? Choose the correct answer below. O The 90% confidence interval O The 95% confidence interval Interpret the results. O A. You can be certain that the mean record high temperature was within the 90% confidence interval for approximately 57 of the 63 days, and was within the 95% confidence interval for approximately 60 of the 63 days. O B. You can be certain that the population mean record high temperature is either between the lower bounds of the 90% and 95% confidence intervals or the upper bounds of the 90% and 95% confidence intervals. O C. You can be 90% confident that the population mean record high temperature is outside the bounds of the 90% confidence interval, and 95% confident for the 95% interval. O D. You can be 90% confident that the population mean record high temperature is between the bounds of the 90% confidence interval, and 95% confident for the 95% interval