

Answered step by step
Verified Expert Solution
Question
1 Approved Answer
how do I calculate capital costs and what's the formula to find the IRR? Sensitivity Capital Costs: IRR 30.0% General partners cost of equity Limited
how do I calculate capital costs and what's the formula to find the IRR?
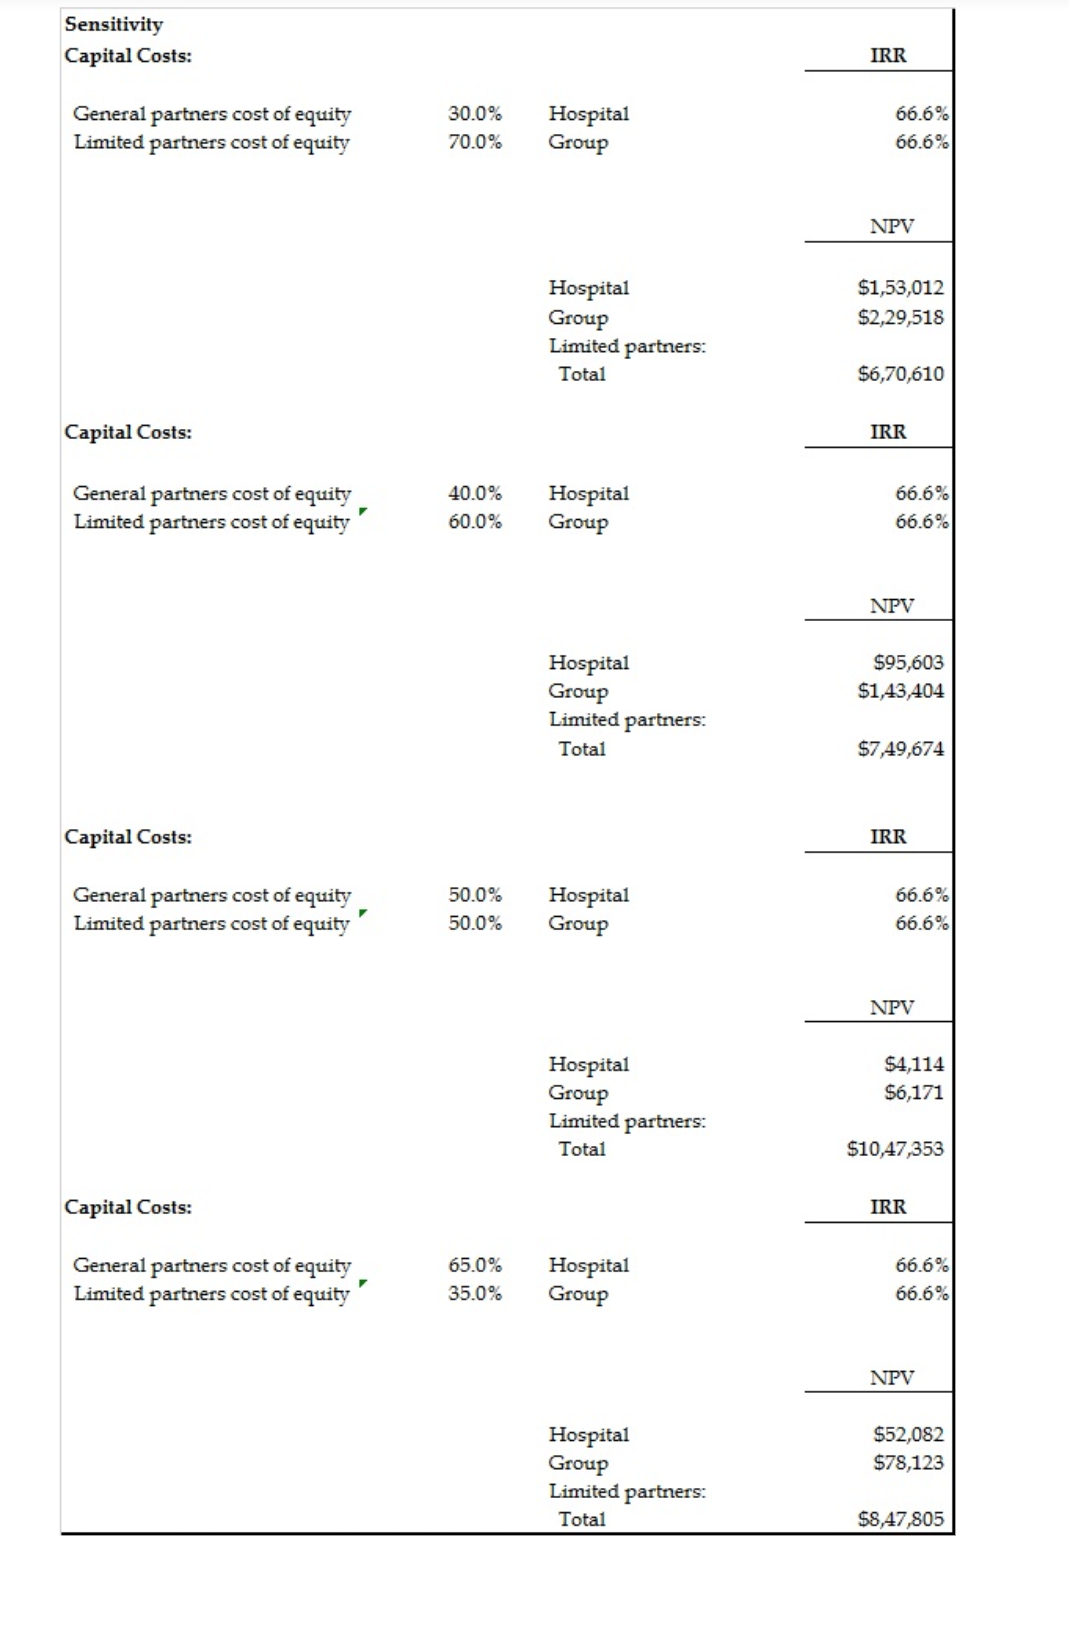
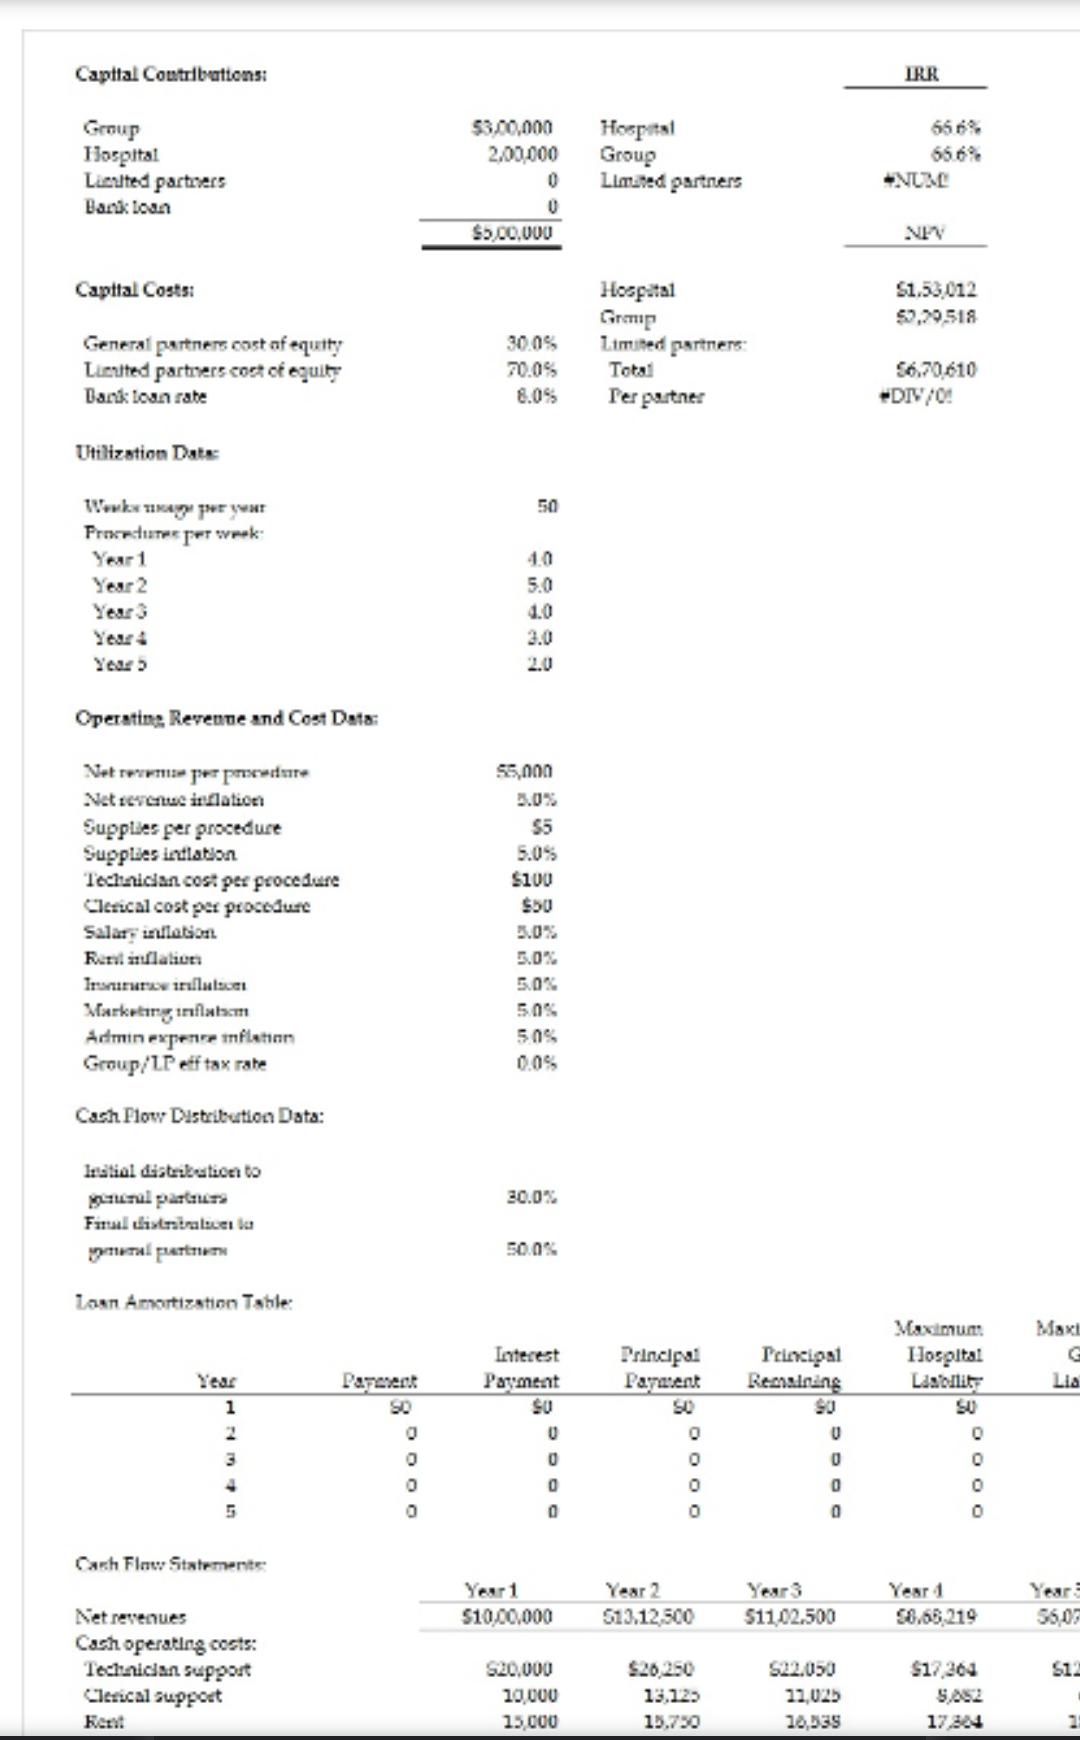
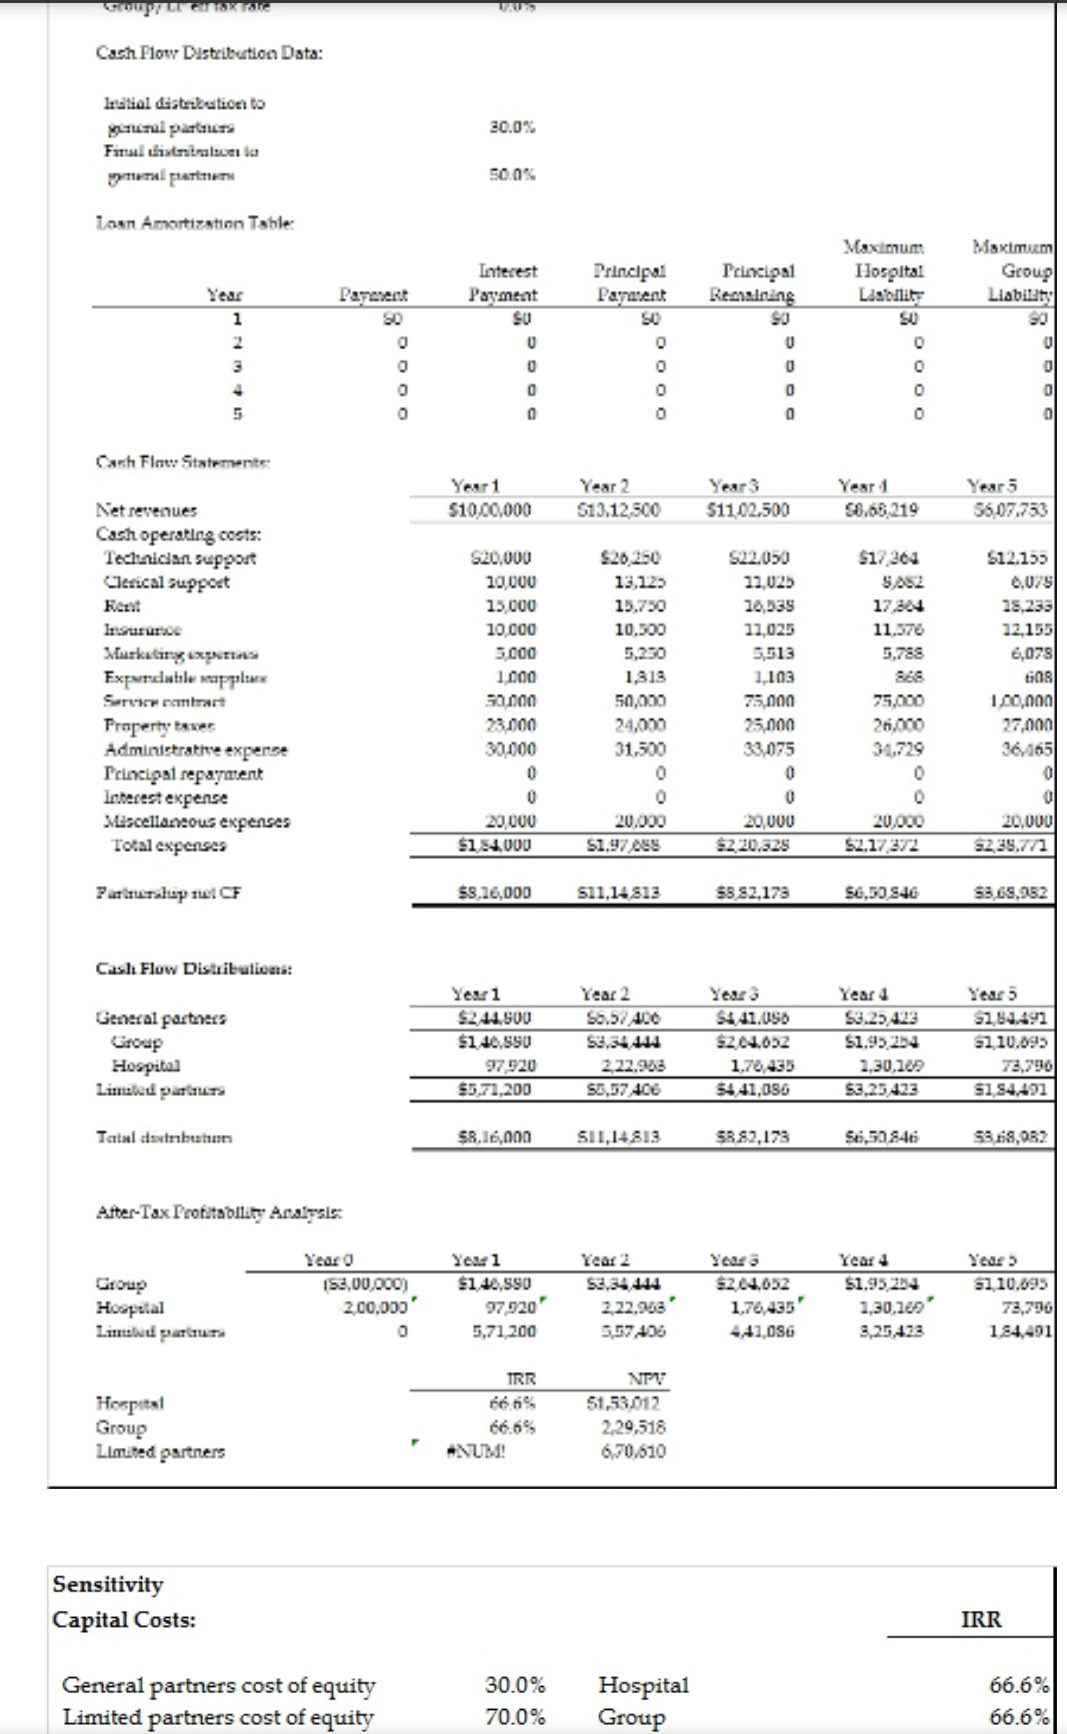
Sensitivity Capital Costs: IRR 30.0% General partners cost of equity Limited partners cost of equity Hospital Group 66.6% 66.6% 70.0% NPV $1,53,012 $2,29,518 Hospital Group Limited partners: Total $6,70,610 Capital Costs: IRR 40.0% 66.6% General partners cost of equity Limited partners cost of equity Hospital Group 60.0% 66.6% NPV $95,603 $1,43,404 Hospital Group Limited partners: Total $7,49,674 Capital Costs: IRR 50.0% General partners cost of equity Limited partners cost of equity Hospital Group 66.6% 66.6% 50.0% NPV $4,114 $6,171 Hospital Group Limited partners: Total $10,47,353 Capital Costs: IRR 65.0% 66.6% General partners cost of equity Limited partners cost of equity Hospital Group 35.0% 66.6% NPV $52,082 $78,123 Hospital Group Limited partners: Total $8,47,805 Capital Contributions: IRR Group Hospital Limited partners Bank loan $300,000 2.00.000 0 0 $5.00.000 Hospital Group Limited partners 656% NUM NY Capttal Costs: $1.53,012 52,20518 30.05 General partners cost of equity Lunited partners coct of equity Dank loan rate Hospital Gromp Limited partners Total Ter partner 20.05 8.0% 56.70.610 DIV/0! Utilization Dates 50 Woke upya Proxectats per week Year 1 Year 2 Year 3 10 5.0 Year Operating Revenue and Cost Data: $5,000 Net per poder Vet serentuinflation Supplies per procedure Supplies indlation Technician cost per procedure Clerical cost per procedure Salariulation Fentilation 55 5.05 $100 SU Inruillas 5.0% 505 Marketing inflam Admin Expense inflation Group/LP eff tax rate 505 0.05 Cash Flow Distribution Data: Intial distribution to 30.0% Serral partners Fital distracer la al pret 50.0% Laun Amortization Table: Maxi Principal Paraent Interest Payment SU Principal Remaining Maximum Ilospital Lability Year Dagenent Lia 1 2 U U 3 oooo 0 U 0 5 0 0 0 Cash Flow Statemente Year 1 $10,00.000 Year 2 513.12,500 Year3 S11.02.500 Year 1 58.65,219 5607 Net revenues Cash operating costs: Technican support Clerical Support Kent $20.000 10 000 15,000 S20,250 13.123 S22.050 22,025 20,339 $17.264 S.AS2 13.730 17.844 2 LAUS Com Cash Flow Distribution Data: Intatiol de tribution to 30.0% al palar Final distraci la pretium Lonn Amortization Table: Interest Payment SU Principal Remaining Maximum Ilospital Liability SU Principal Paraent SO Year Maximum Group Liability 90 Paznent SO 1 2 U U 3 0 0 0 0 4 0 0 0 0 5 0 0 0 Cash Finw Statemente Year 1 $10,00,000 Year 2 513.12,500 Year 1 58.66,219 51102.500 56,07,753 S20.000 $20.250 13,123 13.730 $17.264 9.02 17.34 11.378 5.785 S12.139 0,0791 25,233 12.155 6,078 10,300 Net revenues Cash operating costs: Technical support Clerical Support Kent Insurance Marketing expS Expandable app Servir rart Property tower Administrative expense Principal repayment Interest expense Miscellaneous expenses Total expenses 10,000 15 000 10.000 3.000 1000 50.000 23.000 30.000 0 $22.050 22,025 10,035 11,025 5.513 1,103 75.000 25.000 33.075 0 GOB 1,313 50,000 24,000 31,500 75,000 26,000 31,729 0 1 1.00,000 27,0001 36,165 0 0 20.000 $184,000 0 20.000 20,000 $220.325 20.000 $2.17 272 20,000 5239.772 $1.97ES Parturlup CF $5,16,000 $11,14 513 53.82.173 S6,50 846 53 69,952 Cash Flow Distribution: Year 5 Year 2 S6.5 406 General partners Group Hospital Limated parts Year 1 $2.44.500 $1.46.990 97920 $5,71,200 S441.050 S24.02 1.70.435 $441,056 Year 1 S3.23 423 $1.95.254 1.30.101 $3,25 423 5164491 31.10.09 72,790 184.491 2.22.908 SO,57 406 Tatal hun SR,16,000 SI1,14813 S882,173 S6,50 846 53.68,082 Atter-Tax Protstability Analysis: Yea 1 Group Hospital Liment 153,00,000) 200,000 $1.46,990 97920 5,71 200 ' Year 2 53.34 444 2.22.948' 357.406 Yeaca $2.04.052 1.78435 Year 4 $1.95 204 1,30.109 3,25,428 Year 52.10.095 73,796 184,401 0 4.41,08G TRR NTV Hospital Group Limited partners 51,53012 2.29,518 6,70.610 NUM: Sensitivity Capital Costs: IRR 30.0% General partners cost of equity Limited partners cost of equity Hospital Group 66.6% 66.6% 70.0% Sensitivity Capital Costs: IRR 30.0% General partners cost of equity Limited partners cost of equity Hospital Group 66.6% 66.6% 70.0% NPV $1,53,012 $2,29,518 Hospital Group Limited partners: Total $6,70,610 Capital Costs: IRR 40.0% 66.6% General partners cost of equity Limited partners cost of equity Hospital Group 60.0% 66.6% NPV $95,603 $1,43,404 Hospital Group Limited partners: Total $7,49,674 Capital Costs: IRR 50.0% General partners cost of equity Limited partners cost of equity Hospital Group 66.6% 66.6% 50.0% NPV $4,114 $6,171 Hospital Group Limited partners: Total $10,47,353 Capital Costs: IRR 65.0% 66.6% General partners cost of equity Limited partners cost of equity Hospital Group 35.0% 66.6% NPV $52,082 $78,123 Hospital Group Limited partners: Total $8,47,805 Capital Contributions: IRR Group Hospital Limited partners Bank loan $300,000 2.00.000 0 0 $5.00.000 Hospital Group Limited partners 656% NUM NY Capttal Costs: $1.53,012 52,20518 30.05 General partners cost of equity Lunited partners coct of equity Dank loan rate Hospital Gromp Limited partners Total Ter partner 20.05 8.0% 56.70.610 DIV/0! Utilization Dates 50 Woke upya Proxectats per week Year 1 Year 2 Year 3 10 5.0 Year Operating Revenue and Cost Data: $5,000 Net per poder Vet serentuinflation Supplies per procedure Supplies indlation Technician cost per procedure Clerical cost per procedure Salariulation Fentilation 55 5.05 $100 SU Inruillas 5.0% 505 Marketing inflam Admin Expense inflation Group/LP eff tax rate 505 0.05 Cash Flow Distribution Data: Intial distribution to 30.0% Serral partners Fital distracer la al pret 50.0% Laun Amortization Table: Maxi Principal Paraent Interest Payment SU Principal Remaining Maximum Ilospital Lability Year Dagenent Lia 1 2 U U 3 oooo 0 U 0 5 0 0 0 Cash Flow Statemente Year 1 $10,00.000 Year 2 513.12,500 Year3 S11.02.500 Year 1 58.65,219 5607 Net revenues Cash operating costs: Technican support Clerical Support Kent $20.000 10 000 15,000 S20,250 13.123 S22.050 22,025 20,339 $17.264 S.AS2 13.730 17.844 2 LAUS Com Cash Flow Distribution Data: Intatiol de tribution to 30.0% al palar Final distraci la pretium Lonn Amortization Table: Interest Payment SU Principal Remaining Maximum Ilospital Liability SU Principal Paraent SO Year Maximum Group Liability 90 Paznent SO 1 2 U U 3 0 0 0 0 4 0 0 0 0 5 0 0 0 Cash Finw Statemente Year 1 $10,00,000 Year 2 513.12,500 Year 1 58.66,219 51102.500 56,07,753 S20.000 $20.250 13,123 13.730 $17.264 9.02 17.34 11.378 5.785 S12.139 0,0791 25,233 12.155 6,078 10,300 Net revenues Cash operating costs: Technical support Clerical Support Kent Insurance Marketing expS Expandable app Servir rart Property tower Administrative expense Principal repayment Interest expense Miscellaneous expenses Total expenses 10,000 15 000 10.000 3.000 1000 50.000 23.000 30.000 0 $22.050 22,025 10,035 11,025 5.513 1,103 75.000 25.000 33.075 0 GOB 1,313 50,000 24,000 31,500 75,000 26,000 31,729 0 1 1.00,000 27,0001 36,165 0 0 20.000 $184,000 0 20.000 20,000 $220.325 20.000 $2.17 272 20,000 5239.772 $1.97ES Parturlup CF $5,16,000 $11,14 513 53.82.173 S6,50 846 53 69,952 Cash Flow Distribution: Year 5 Year 2 S6.5 406 General partners Group Hospital Limated parts Year 1 $2.44.500 $1.46.990 97920 $5,71,200 S441.050 S24.02 1.70.435 $441,056 Year 1 S3.23 423 $1.95.254 1.30.101 $3,25 423 5164491 31.10.09 72,790 184.491 2.22.908 SO,57 406 Tatal hun SR,16,000 SI1,14813 S882,173 S6,50 846 53.68,082 Atter-Tax Protstability Analysis: Yea 1 Group Hospital Liment 153,00,000) 200,000 $1.46,990 97920 5,71 200 ' Year 2 53.34 444 2.22.948' 357.406 Yeaca $2.04.052 1.78435 Year 4 $1.95 204 1,30.109 3,25,428 Year 52.10.095 73,796 184,401 0 4.41,08G TRR NTV Hospital Group Limited partners 51,53012 2.29,518 6,70.610 NUM: Sensitivity Capital Costs: IRR 30.0% General partners cost of equity Limited partners cost of equity Hospital Group 66.6% 66.6% 70.0%Step by Step Solution
There are 3 Steps involved in it
Step: 1

Get Instant Access to Expert-Tailored Solutions
See step-by-step solutions with expert insights and AI powered tools for academic success
Step: 2

Step: 3
Ace Your Homework with AI
Get the answers you need in no time with our AI-driven, step-by-step assistance
Get Started
Financial Instability Toolkit For Interpreting Boom And Bust Cycles
Authors: V. D'Apice, G. Ferri
1st Edition
023024811X, 9780230248113