

Answered step by step
Verified Expert Solution
Question
1 Approved Answer
How do I do a sensitivity analysis of this graph? Equity/share at perpetual growth rate sensitivities Long term growth rate 2.5% 2.8% 3.0% 3.3% 3.5%
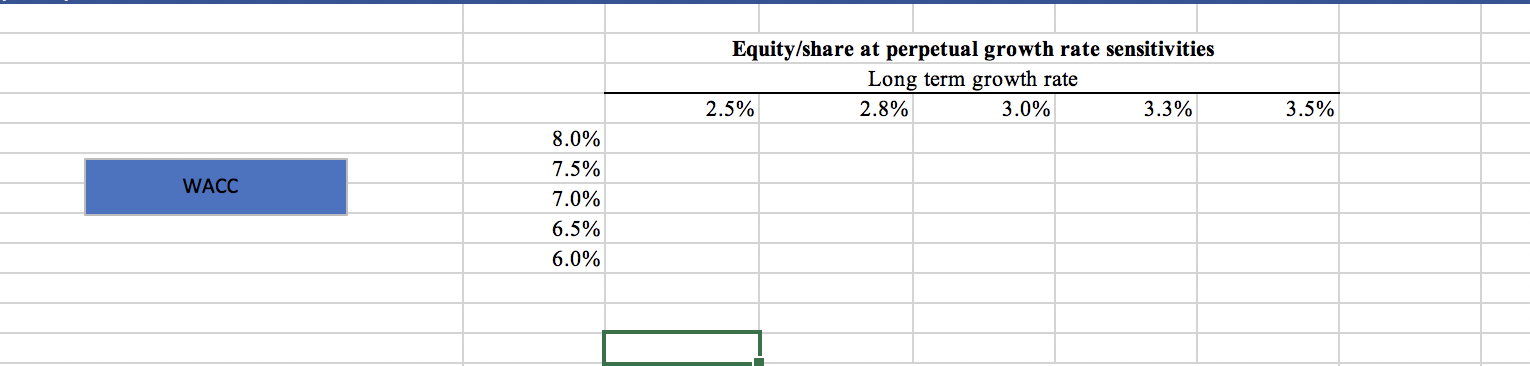
How do I do a sensitivity analysis of this graph?
Equity/share at perpetual growth rate sensitivities Long term growth rate 2.5% 2.8% 3.0% 3.3% 3.5% WACC 8.0% 7.5% 7.0% 6.5% 6.0%Step by Step Solution
There are 3 Steps involved in it
Step: 1

Get Instant Access to Expert-Tailored Solutions
See step-by-step solutions with expert insights and AI powered tools for academic success
Step: 2

Step: 3
Ace Your Homework with AI
Get the answers you need in no time with our AI-driven, step-by-step assistance
Get Started
The Basics Of Public Budgeting And Financial Management
Authors: Charles E. Menifield
4th Edition
0761872116, 978-0761872115