Answered step by step
Verified Expert Solution
Link Copied!

Question

1 Approved Answer

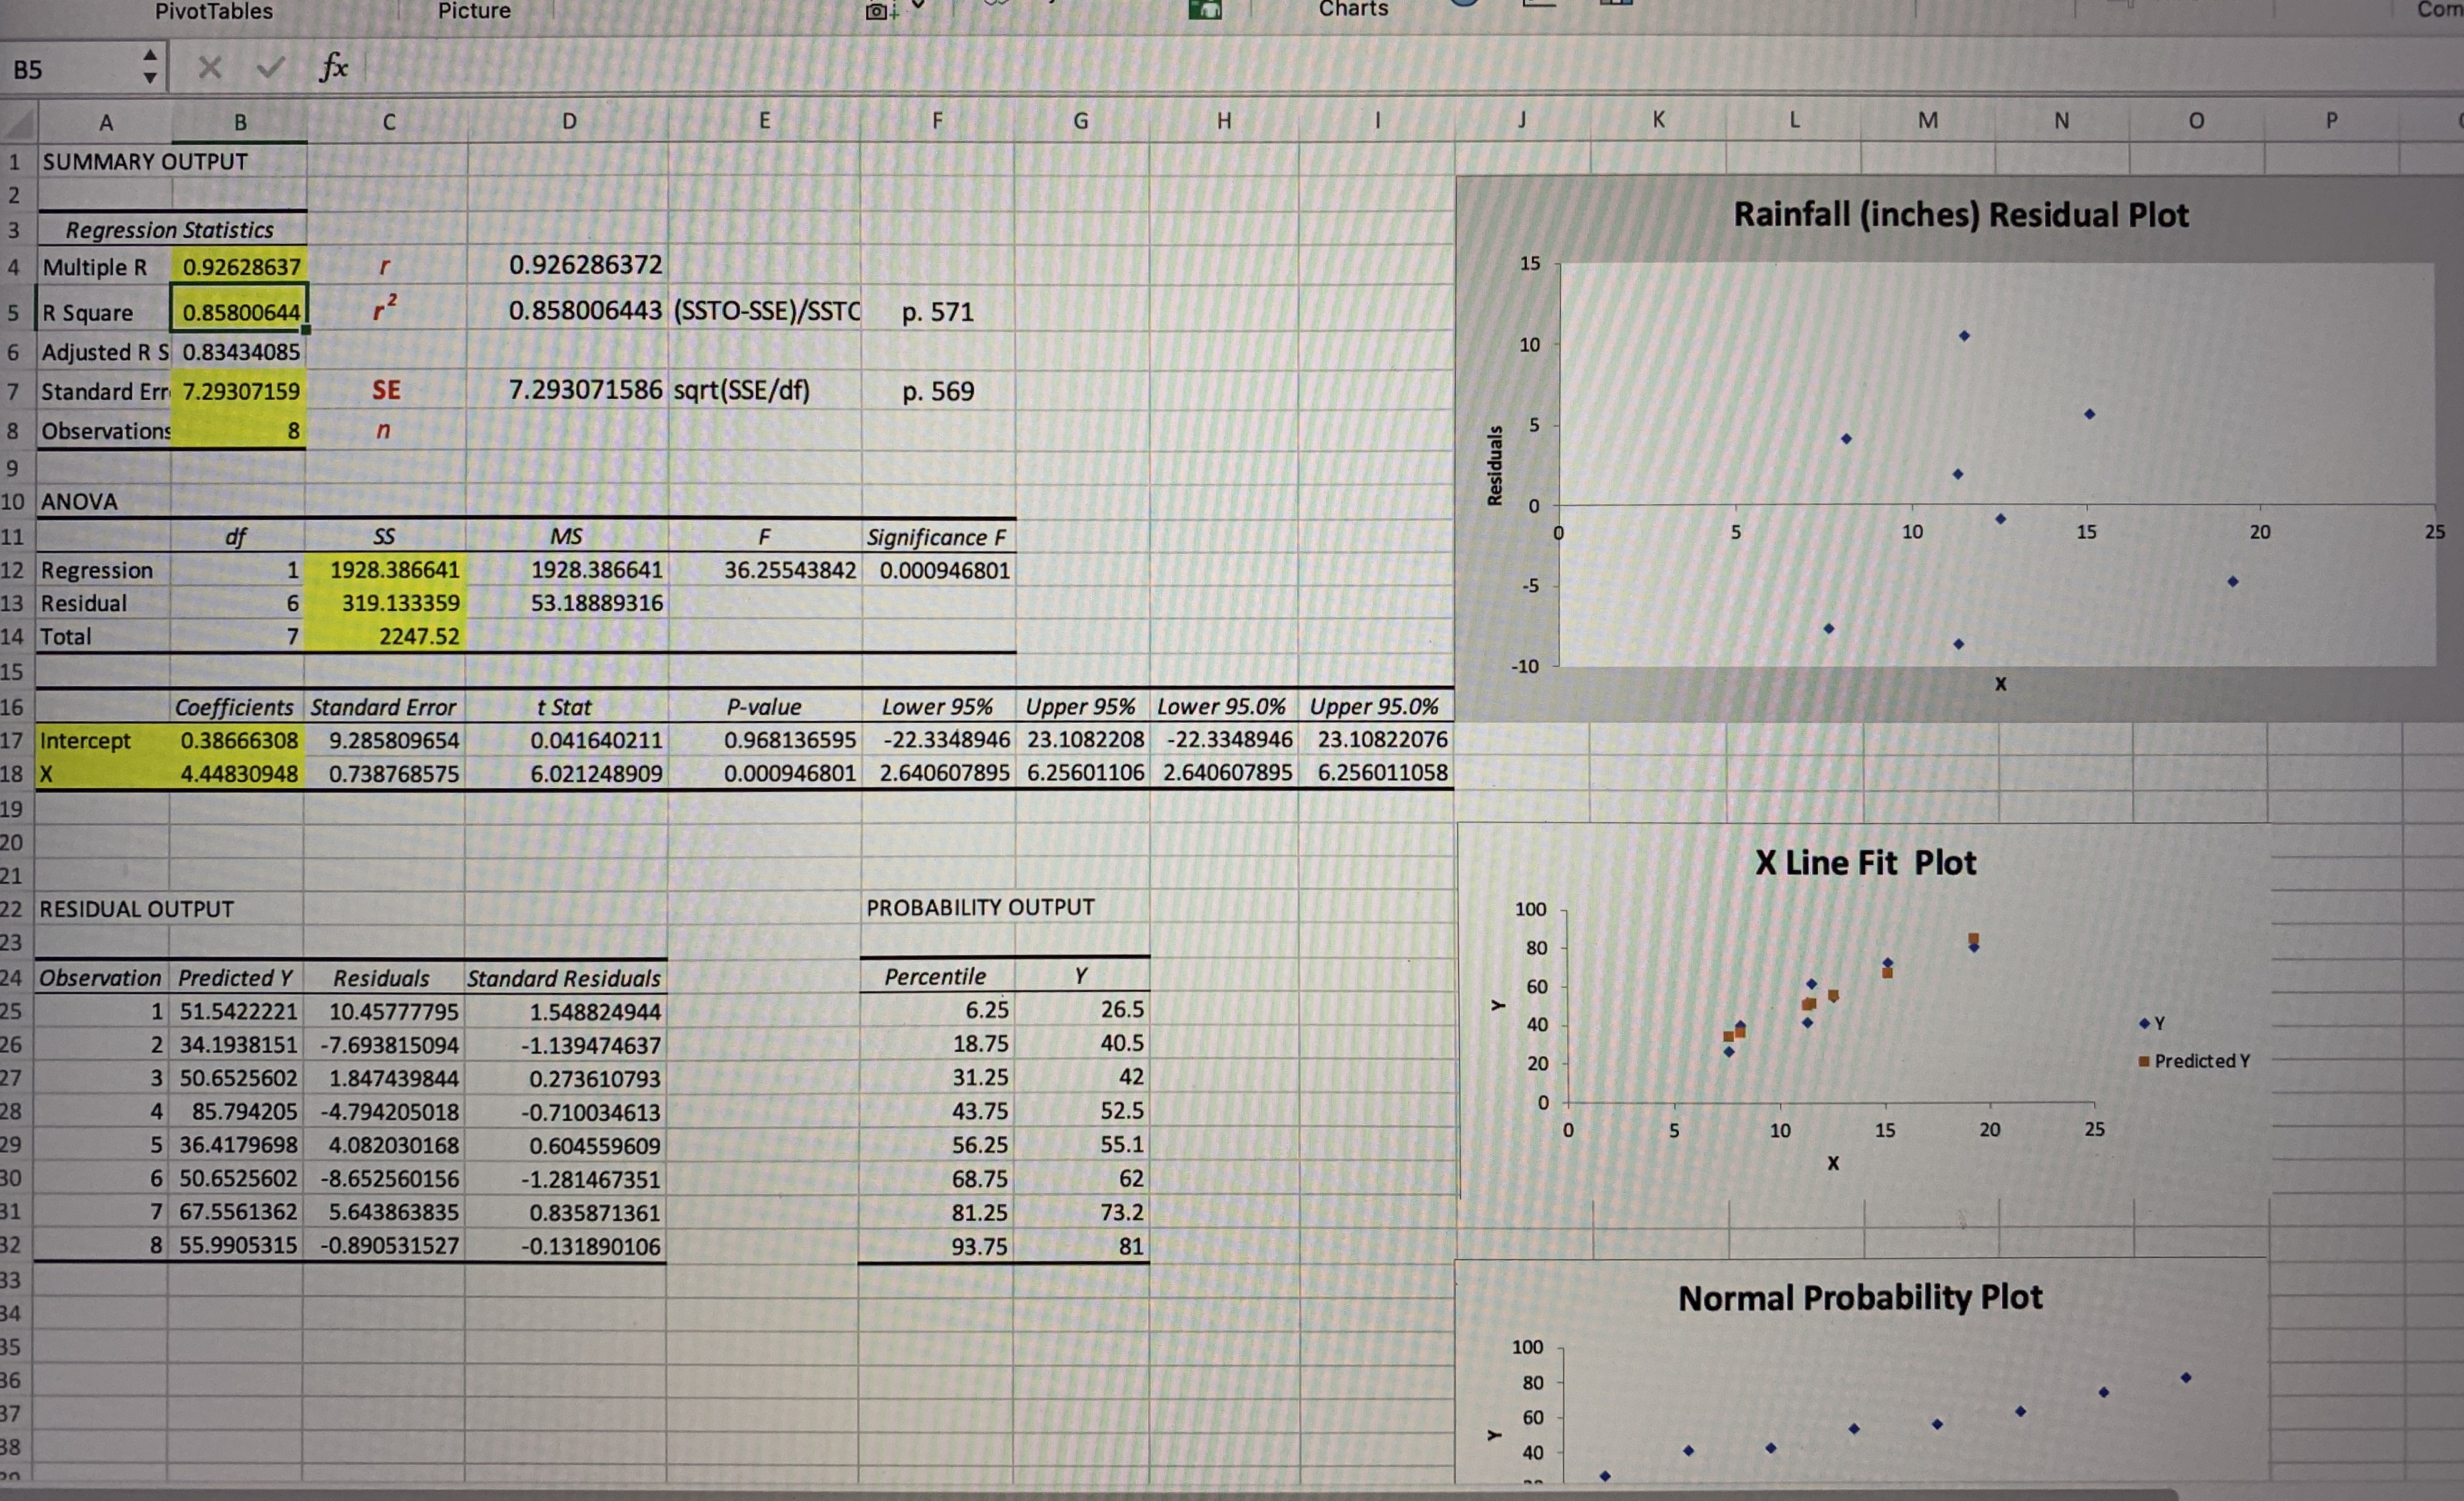
How do I find the formula and answer for this question. If the rainfall is 9.25 inches, what is the predicted wheat yield? (Type your

How do I find the formula and answer for this question.

image text in transcribedimage text in transcribedimage text in transcribed
If the rainfall is 9.25 inches, what is the predicted wheat yield? (Type your answer as an appropriate formula, as demonstrated in lecture videos or in class, and include units of measure.) Copy the residual plot you created for this dataset, paste it below (as an image file; per demonstrations),PivotTables Picture Charts Com B5 X V fx A B C D G H K L M N O P 1 SUMMARY OUTPUT N 3 Regression Statistics Rainfall (inches) Residual Plot Multiple R 0.92628637 0.926286372 15 R Square 0.85800644 2 0.858006443 (SSTO-SSE)/SSTO p. 571 Adjusted R S 0.83434085 10 Standard Err 7.29307159 SE 7.293071586 sqrt(SSE/df) p. 569 8 Observations 8 n un 9 10 ANOVA Residuals 0 11 df SS MS Significance F 10 15 20 25 12 Regression 1928.386641 1928.386641 36.25543842 0.000946801 5 13 Residual 319.133359 53.18889316 14 Total VOH 2247.52 15 10 X 16 Coefficients Standard Error t Stat P-value Lower 95% Upper 95% Lower 95.0% Upper 95.0% 7 Intercept 0.38666308 9.285809654 0.041640211 0.968136595 -22.3348946 23.1082208 -22.3348946 23.10822076 18 4.44830948 0.738768575 6.021248909 0.000946801 2.640607895 6.25601106 2.640607895 6.256011058 19 20 21 X Line Fit Plot 22 RESIDUAL OUTPUT PROBABILITY OUTPUT 100 23 80 24 Observation Predicted Y Residuals Standard Residuals Percentile Y 60 25 1 51.5422221 10.45777795 1.548824944 6.25 26.5 40 26 2 34.1938151 -7.693815094 -1.139474637 18.75 40.5 3 50.6525602 1.847439844 0.273610793 31.25 42 20 Predicted Y 4 85.794205 -4.794205018 -0.710034613 43.75 52.5 0 56.25 55.1 5 10 15 5 36.4179698 20 25 4.082030168 0.604559609 X 6 50.6525602 -8.652560156 -1.281467351 68.75 62 7 67.5561362 5.643863835 0.835871361 81.25 73.2 8 55.9905315 -0.890531527 -0.131890106 93.75 81 Normal Probability Plot 100 80 60\f

Step by Step Solution

There are 3 Steps involved in it

Step: 1

blur-text-image

Get Instant Access to Expert-Tailored Solutions

See step-by-step solutions with expert insights and AI powered tools for academic success

Step: 2

blur-text-image

Step: 3

blur-text-image

Ace Your Homework with AI

Get the answers you need in no time with our AI-driven, step-by-step assistance

Get Started

Recommended Textbook for

Algebra 2

Authors: Randall I. Charles, Basia Hall, Dan Kennedy, Laurie E Bass

Student Edition

0133500438, 978-0133500431

More Books

Students also viewed these Mathematics questions