 How do I know my forecast?
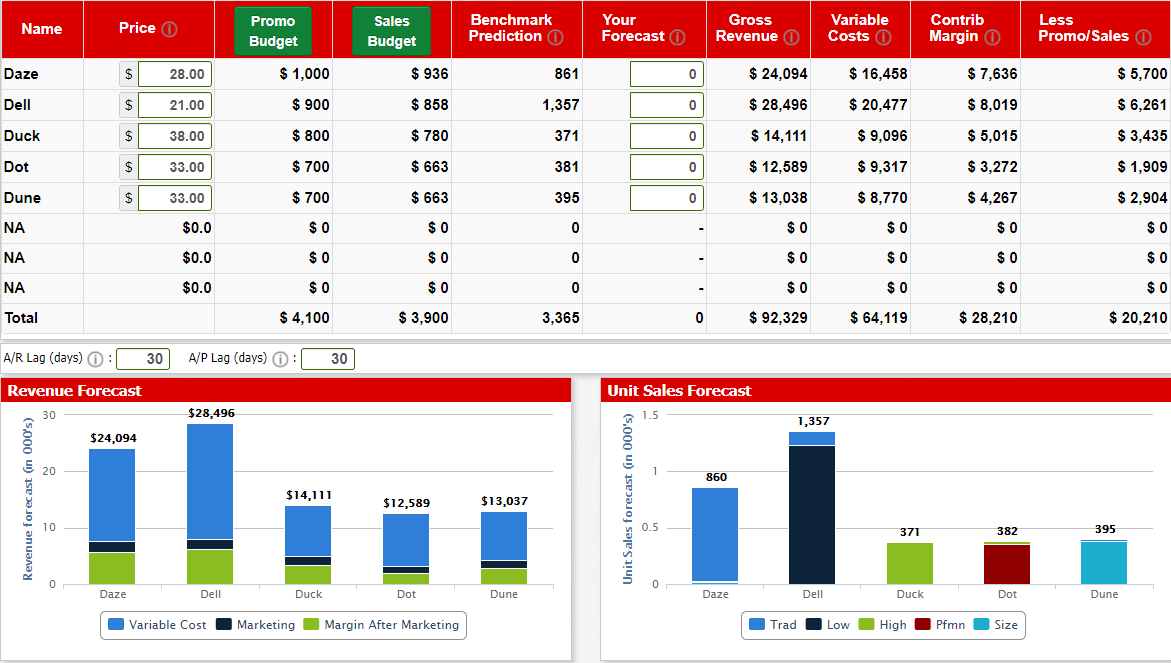
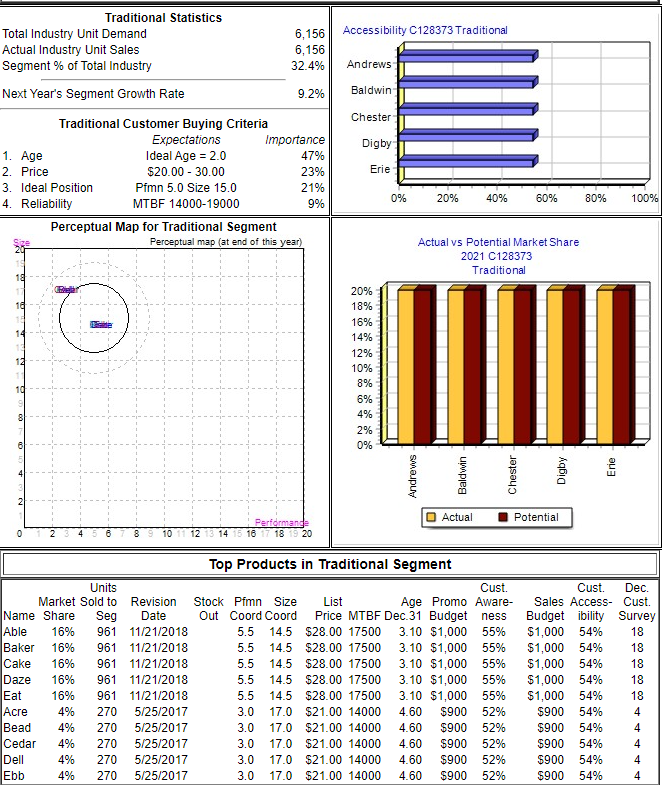
Price Name Promo Budget Variable Sales Budget Benchmark Prediction Your Forecast Gross Revenue 0 Costs Contrib Margin 0 Less Promo/Sales Daze 28.00 $ 1,000 $ 936 861 0 $ 24,094 $ 16,458 $ 7,636 $ 5,700 Dell $ 21.00 $ 900 $ 858 1,357 0 $ 28,496 $ 20,477 $ 8,019 $ 6,261 Duck $ 38.00 $ 800 $ 780 371 0 $ 14,111 $ 9,096 $ 5,015 $ 3,435 Dot $ 33.00 $ 700 $ 663 381 0 $ 12,589 $ 9,317 $ 3,272 $ 1,909 Dune $ 33.00 $ 700 $ 663 395 0 $ 13,038 $ 8,770 $ 4,267 $ 2,904 NA $0.0 $0 $0 0 $0 $0 $0 $0 NA $0.0 $0 $0 0 $0 $0 $0 $0 NA $0.0 $0 $0 0 $0 $0 $0 $0 Total $ 4,100 $ 3,900 3,365 0 $ 92,329 $ 64,119 $ 28,210 $ 20,210 A/R Lag (days) : 30 A/P Lag (days) : 30 Revenue Forecast Unit Sales Forecast 30 $28,496 1,357 $24,094 20 860 Revenue forecast (in 000's) $14,111 $12,589 $13,037 Unit Sales forecast (in 000's) 10 371 382 395 0 Daze Dell Duck Dot Dune Daze Dell Duck Dot Dune Variable Cost Marketing Margin After Marketing Trad Low High Pfmn Size 80% 100% Traditional Statistics Total Industry Unit Demand 6,156 Accessibility C128373 Traditional Actual Industry Unit Sales 6,156 Segment % of Total Industry 32.4% Andrews Next Year's Segment Growth Rate 9.2% Baldwin Traditional Customer Buying Criteria Chester Expectations Importance Digby 1. Age Ideal Age = 2.0 47% 2. Price $20.00 - 30.00 23% Erie 3. Ideal Position Pimn 5.0 Size 15.0 21% 0% 20% 40% 9% 60% 4. Reliability MTBF 14000-19000 Perceptual Map for Traditional Segment Perceptual map (at end of this year) Actual vs Potential Market Share 2021 C128373 Traditional 20% 18% 16% 14% 12% 10% 8% 6% 4% 2% 0% 16 10 09 & Andrews Baldwin Chester Erie Digby Performand Actual Potential 0 2 10 11 12 13 14 15 16 17 18 19 20 Top Products in Traditional Segment Units Cust. Cust. Dec. Market Sold to Revision Stock Pfmn Size List Age Promo Aware- Sales Access- Cust. Name Share Seg Date Out Coord Coord Price MTBF Dec 31 Budget ness Budgetibility Survey Able 16% 961 11/21/2018 5.5 14.5 $28.00 17500 3.10 $1,000 55% $1,000 54% 18 Baker 16% 961 11/21/2018 5.5 14.5 $28.00 17500 3.10 $1,000 55% $1,000 54% 18 Cake 16% 961 11/21/2018 5.5 14.5 $28.00 17500 3.10 $1,000 55% $1,000 54% 18 Daze 16% 961 11/21/2018 5.5 14.5 $28.00 17500 3.10 $1,000 55% $1,000 54% 18 Eat 16% 961 11/21/2018 5.5 14.5 $28.00 17500 3.10 $1,000 55% $1,000 54% 18 Acre 4% 270 5/25/2017 3.0 17,0 $21.00 14000 4.60 $900 52% $900 54% 4 Bead 4% 270 5/25/2017 3.0 17.0 $21.00 14000 4.60 $900 52% $900 54% 4 Cedar 4% 270 5/25/2017 3.0 17.0 $21.00 14000 4.60 $900 52% $900 54% 4 Dell 4% 270 5/25/2017 3.0 17.0 $21.00 14000 4.60 $900 52% $900 54% 4 Ebb 4% 270 5/25/2017 3.0 17,0 $21.00 14000 4.60 $900 52% $900 54% 4 Price Name Promo Budget Variable Sales Budget Benchmark Prediction Your Forecast Gross Revenue 0 Costs Contrib Margin 0 Less Promo/Sales Daze 28.00 $ 1,000 $ 936 861 0 $ 24,094 $ 16,458 $ 7,636 $ 5,700 Dell $ 21.00 $ 900 $ 858 1,357 0 $ 28,496 $ 20,477 $ 8,019 $ 6,261 Duck $ 38.00 $ 800 $ 780 371 0 $ 14,111 $ 9,096 $ 5,015 $ 3,435 Dot $ 33.00 $ 700 $ 663 381 0 $ 12,589 $ 9,317 $ 3,272 $ 1,909 Dune $ 33.00 $ 700 $ 663 395 0 $ 13,038 $ 8,770 $ 4,267 $ 2,904 NA $0.0 $0 $0 0 $0 $0 $0 $0 NA $0.0 $0 $0 0 $0 $0 $0 $0 NA $0.0 $0 $0 0 $0 $0 $0 $0 Total $ 4,100 $ 3,900 3,365 0 $ 92,329 $ 64,119 $ 28,210 $ 20,210 A/R Lag (days) : 30 A/P Lag (days) : 30 Revenue Forecast Unit Sales Forecast 30 $28,496 1,357 $24,094 20 860 Revenue forecast (in 000's) $14,111 $12,589 $13,037 Unit Sales forecast (in 000's) 10 371 382 395 0 Daze Dell Duck Dot Dune Daze Dell Duck Dot Dune Variable Cost Marketing Margin After Marketing Trad Low High Pfmn Size 80% 100% Traditional Statistics Total Industry Unit Demand 6,156 Accessibility C128373 Traditional Actual Industry Unit Sales 6,156 Segment % of Total Industry 32.4% Andrews Next Year's Segment Growth Rate 9.2% Baldwin Traditional Customer Buying Criteria Chester Expectations Importance Digby 1. Age Ideal Age = 2.0 47% 2. Price $20.00 - 30.00 23% Erie 3. Ideal Position Pimn 5.0 Size 15.0 21% 0% 20% 40% 9% 60% 4. Reliability MTBF 14000-19000 Perceptual Map for Traditional Segment Perceptual map (at end of this year) Actual vs Potential Market Share 2021 C128373 Traditional 20% 18% 16% 14% 12% 10% 8% 6% 4% 2% 0% 16 10 09 & Andrews Baldwin Chester Erie Digby Performand Actual Potential 0 2 10 11 12 13 14 15 16 17 18 19 20 Top Products in Traditional Segment Units Cust. Cust. Dec. Market Sold to Revision Stock Pfmn Size List Age Promo Aware- Sales Access- Cust. Name Share Seg Date Out Coord Coord Price MTBF Dec 31 Budget ness Budgetibility Survey Able 16% 961 11/21/2018 5.5 14.5 $28.00 17500 3.10 $1,000 55% $1,000 54% 18 Baker 16% 961 11/21/2018 5.5 14.5 $28.00 17500 3.10 $1,000 55% $1,000 54% 18 Cake 16% 961 11/21/2018 5.5 14.5 $28.00 17500 3.10 $1,000 55% $1,000 54% 18 Daze 16% 961 11/21/2018 5.5 14.5 $28.00 17500 3.10 $1,000 55% $1,000 54% 18 Eat 16% 961 11/21/2018 5.5 14.5 $28.00 17500 3.10 $1,000 55% $1,000 54% 18 Acre 4% 270 5/25/2017 3.0 17,0 $21.00 14000 4.60 $900 52% $900 54% 4 Bead 4% 270 5/25/2017 3.0 17.0 $21.00 14000 4.60 $900 52% $900 54% 4 Cedar 4% 270 5/25/2017 3.0 17.0 $21.00 14000 4.60 $900 52% $900 54% 4 Dell 4% 270 5/25/2017 3.0 17.0 $21.00 14000 4.60 $900 52% $900 54% 4 Ebb 4% 270 5/25/2017 3.0 17,0 $21.00 14000 4.60 $900 52% $900 54% 4