

Answered step by step
Verified Expert Solution
Question
1 Approved Answer
how do I set this up in excel I keep running regression and getting different numbers can someone please give me steps to setting this
how do I set this up in excel I keep running regression and getting different numbers
can someone please give me steps to setting this up in excel I don't know what I'm doing wrong
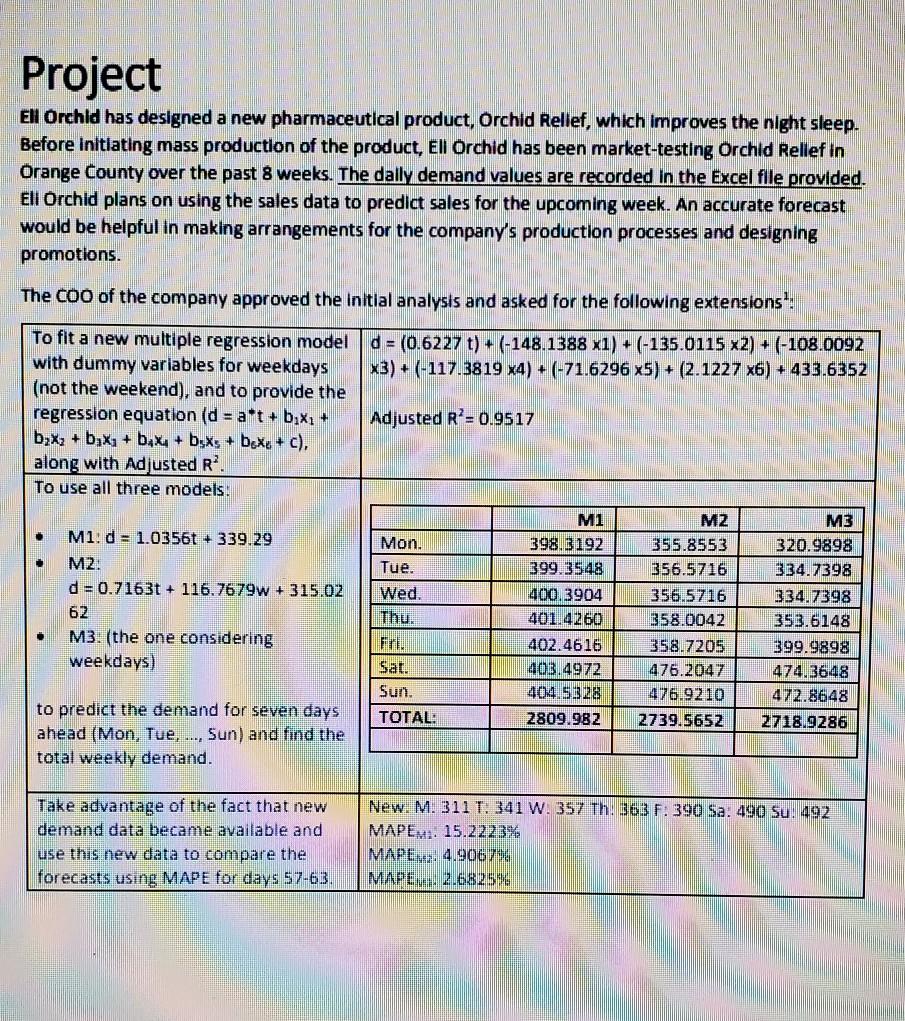
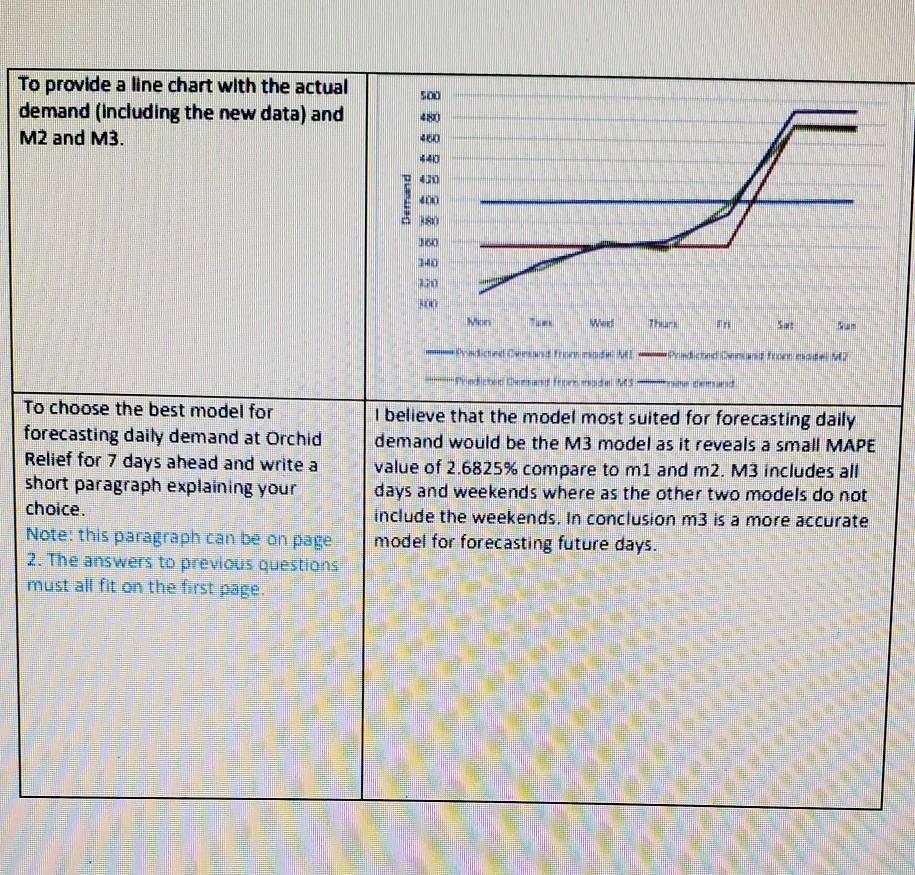
Project Ell Orchid has designed a new pharmaceutical product, Orchid Relief, which improves the night sleep. Before initiating mass production of the product, Ell Orchid has been market-testing Orchid Relief in Orange County over the past 8 weeks. The daily demand values are recorded in the Excel file provided. Eli Orchid plans on using the sales data to predict sales for the upcoming week. An accurate forecast would be helpful in making arrangements for the company's production processes and designing promotions. The COO of the company approved the initial analysis and asked for the following extensions': d = (0.6227 t) + (-148.1388 x1) + (-135.0115 x2) + (-108.0092 x3) + (-117.3819 x4) + (-71.6296 x5) + (2.1227 x6) + 433.6352 To fit a new multiple regression model with dummy variables for weekdays (not the weekend), and to provide the regression equation (d = a*t + b;X; + bzXz+byx+ box + bsxs + boxe + c), along with Adjusted R'. To use all three models: Adjusted R=0.9517 Mon. Tue. Wed M1: d = 1.0356t + 339.29 M2. d= 0.7163t + 116.7679w + 315.02 62 M3. (the one considering weekdays) M1 398.3192 399.3548 400.3904 401.4260 402.4616 403.4972 404.5328 2809.982 M2 355.8553 356.5716 356.5716 358.0042 358.7205 476.2047 476.9210 2739.5652 M3 320.9898 334.7398 334.7398 353.6148 399.9898 474.3648 472.8648 2718.9286 Sun. TOTAL: to predict the demand for seven days ahead (Mon, Tue, ..., Sun) and find the total weekly demand. Take advantage of the fact that new demand data became available and use this new data to compare the forecasts using MAPE for days 57-63. New. M. 311 T. 341 W. 357 Th. 363 F. 390 Sa: 490 Su. 492 MAPEM.. 15.2223% MAPE: 4.9067 MAPE 2.68257 500 To provide a line chart with the actual demand (Including the new data) and M2 and M3. 40 200 440 19 400 Demand f F 200 BAY NE M UN w Thu __ To choose the best model for forecasting daily demand at Orchid Relief for 7 days ahead and write a short paragraph explaining your choice. Note: this paragraph can be on page 2. The answers to previous questions must all fit on the first page I believe that the model most suited for forecasting daily demand would be the M3 model as it reveals a small MAPE value of 2.6825% compare to mi and m2. M3 includes all days and weekends where as the other two models do not include the weekends. In conclusion m3 is a more accurate model for forecasting future days. Project Ell Orchid has designed a new pharmaceutical product, Orchid Relief, which improves the night sleep. Before initiating mass production of the product, Ell Orchid has been market-testing Orchid Relief in Orange County over the past 8 weeks. The daily demand values are recorded in the Excel file provided. Eli Orchid plans on using the sales data to predict sales for the upcoming week. An accurate forecast would be helpful in making arrangements for the company's production processes and designing promotions. The COO of the company approved the initial analysis and asked for the following extensions': d = (0.6227 t) + (-148.1388 x1) + (-135.0115 x2) + (-108.0092 x3) + (-117.3819 x4) + (-71.6296 x5) + (2.1227 x6) + 433.6352 To fit a new multiple regression model with dummy variables for weekdays (not the weekend), and to provide the regression equation (d = a*t + b;X; + bzXz+byx+ box + bsxs + boxe + c), along with Adjusted R'. To use all three models: Adjusted R=0.9517 Mon. Tue. Wed M1: d = 1.0356t + 339.29 M2. d= 0.7163t + 116.7679w + 315.02 62 M3. (the one considering weekdays) M1 398.3192 399.3548 400.3904 401.4260 402.4616 403.4972 404.5328 2809.982 M2 355.8553 356.5716 356.5716 358.0042 358.7205 476.2047 476.9210 2739.5652 M3 320.9898 334.7398 334.7398 353.6148 399.9898 474.3648 472.8648 2718.9286 Sun. TOTAL: to predict the demand for seven days ahead (Mon, Tue, ..., Sun) and find the total weekly demand. Take advantage of the fact that new demand data became available and use this new data to compare the forecasts using MAPE for days 57-63. New. M. 311 T. 341 W. 357 Th. 363 F. 390 Sa: 490 Su. 492 MAPEM.. 15.2223% MAPE: 4.9067 MAPE 2.68257 500 To provide a line chart with the actual demand (Including the new data) and M2 and M3. 40 200 440 19 400 Demand f F 200 BAY NE M UN w Thu __ To choose the best model for forecasting daily demand at Orchid Relief for 7 days ahead and write a short paragraph explaining your choice. Note: this paragraph can be on page 2. The answers to previous questions must all fit on the first page I believe that the model most suited for forecasting daily demand would be the M3 model as it reveals a small MAPE value of 2.6825% compare to mi and m2. M3 includes all days and weekends where as the other two models do not include the weekends. In conclusion m3 is a more accurate model for forecasting future daysStep by Step Solution
There are 3 Steps involved in it
Step: 1

Get Instant Access to Expert-Tailored Solutions
See step-by-step solutions with expert insights and AI powered tools for academic success
Step: 2

Step: 3
Ace Your Homework with AI
Get the answers you need in no time with our AI-driven, step-by-step assistance
Get Started
Better Than Alpha Three Steps To Capturing Excess Returns In A Changing World
Authors: Christopher M. Schelling
1st Edition
1264257651,126425766X