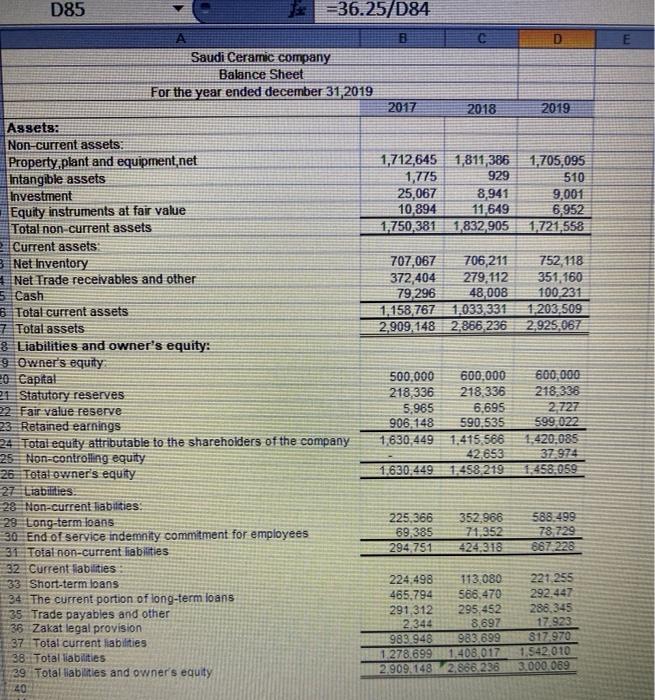
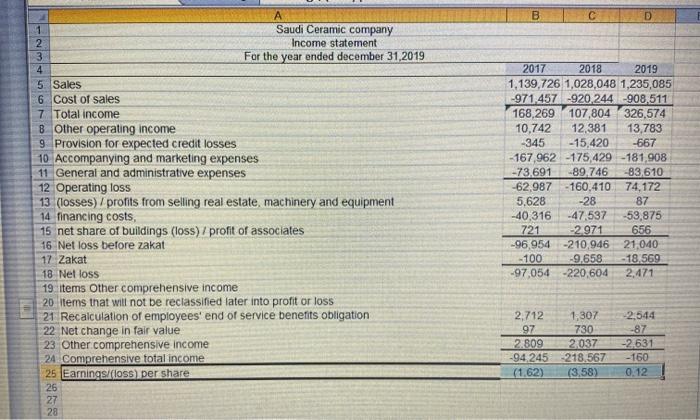
how l find 2018
earnings per share = net income/ weighted average common shares outstanding
and
payout Ratio= cash Dividendset income
and
price-earnings ratio= Market price per share of stock/ earnings per share
D85 =36.25/D84 8 Saudi Ceramic company Balance Sheet For the year ended december 31, 2019 2017 2018 2019 1,712,645 1,811,386 1,705,095 1,775 929 510 25,067 8,941 9,001 10,894 11.649 6,952 1,750,381 1,832,905 1,721,558 707,067 706,211 372,404 279,112 79 296 48,008 1,158 767 1,033 331 2.909,148 2.866 236 752 118 351 160 100 231 1203,509 2.925,067 Assets: Non-current assets: Property.plant and equipment net Intangible assets Investment Equity instruments at fair value Total non-current assets Current assets 3 Net Inventory + Net Trade receivables and other 5 Cash 6 Total current assets 7 Total assets & Liabilities and owner's equity: 9 Owner's equity 20 Capital 21 Statutory reserves 22 Fair value reserve 23. Retained earnings 24 Total equity attributable to the shareholders of the company 25 Non-controlling equity 26 Total owner's equity 27 Liabilities. 28 Non-current liabilities: 28 Long-term loans 30 End of service indemnity commitment for employees 31 Total non-current liabilities 32 Current Habilities 33 Short-term loans 24 The current portion of long-term loans 35 Trade payables and other 36 Zakat legal provision 37 Total current liabilities 38 Total liabilities 39 Total liabilities and owner's equity 40 500.000 600,000 218,336 218,336 5.965 6.695 906,148 590.535 1630 449 1,415,566 42.653 1.630,449 1.458 219 600 000 218,338 2.727 599 022 1.420.085 37.974 1.458,059 225.366 69,385 294.751 352,966 71,352 424 318 588,499 78 729 8672228 224.498 113.080 465,794 566,470 291,312 295,452 2,344 8.697 983.948 983.699 1 278,699 1,408,017 2.90941482.866:236 221 255 292.447 288.345 17.923 817970 1.542010 3.000.069 B D 1 Saudi Ceramic company 2 Income statement 3 For the year ended december 31,2019 4 5. Sales 6 Cost of sales 7 Total income 8 Other operating income 9 Provision for expected credit losses 10 Accompanying and marketing expenses 11 General and administrative expenses 12 Operating loss 13 (losses) profits from selling real estate machinery and equipment 14 financing costs 15 net share of buildings (loss) / profit of associates 16 Net loss before zakat 17 Zakat 18 Net loss 19 items Other comprehensive income 20 items that will not be reclassified later into profit or loss 21 Recalculation of employees' end of service benefits obligation 22 Net change in fair value 23 Other comprehensive income 24 Comprehensive total income 25 Earnings (loss) per share 26 27 28 2017 2018 2019 1,139,726 1,028,048 1,235,085 -971.457 -920.244 -908.511 168,269 107,804 326,574 10,742 12,381 13,783 -345 -15,420 -667 167.962 -175,429 181,908 -73.691 -89,746 -83.610 -62,987 - 160,410 74,172 5.628 -28 87 -40,316 -47.537 -59,875 721 -2971 656 -96,954 -210 946 21.040 -100 -9,658 - 18,569 -97,054-220,604 2,471 2,712 97 2.809 -94 245 (1.62) 1,307 730 2,037 -218.567 (3.58) -2,544 -87 -2.631 - 160 0.12 D85 =36.25/D84 8 Saudi Ceramic company Balance Sheet For the year ended december 31, 2019 2017 2018 2019 1,712,645 1,811,386 1,705,095 1,775 929 510 25,067 8,941 9,001 10,894 11.649 6,952 1,750,381 1,832,905 1,721,558 707,067 706,211 372,404 279,112 79 296 48,008 1,158 767 1,033 331 2.909,148 2.866 236 752 118 351 160 100 231 1203,509 2.925,067 Assets: Non-current assets: Property.plant and equipment net Intangible assets Investment Equity instruments at fair value Total non-current assets Current assets 3 Net Inventory + Net Trade receivables and other 5 Cash 6 Total current assets 7 Total assets & Liabilities and owner's equity: 9 Owner's equity 20 Capital 21 Statutory reserves 22 Fair value reserve 23. Retained earnings 24 Total equity attributable to the shareholders of the company 25 Non-controlling equity 26 Total owner's equity 27 Liabilities. 28 Non-current liabilities: 28 Long-term loans 30 End of service indemnity commitment for employees 31 Total non-current liabilities 32 Current Habilities 33 Short-term loans 24 The current portion of long-term loans 35 Trade payables and other 36 Zakat legal provision 37 Total current liabilities 38 Total liabilities 39 Total liabilities and owner's equity 40 500.000 600,000 218,336 218,336 5.965 6.695 906,148 590.535 1630 449 1,415,566 42.653 1.630,449 1.458 219 600 000 218,338 2.727 599 022 1.420.085 37.974 1.458,059 225.366 69,385 294.751 352,966 71,352 424 318 588,499 78 729 8672228 224.498 113.080 465,794 566,470 291,312 295,452 2,344 8.697 983.948 983.699 1 278,699 1,408,017 2.90941482.866:236 221 255 292.447 288.345 17.923 817970 1.542010 3.000.069 B D 1 Saudi Ceramic company 2 Income statement 3 For the year ended december 31,2019 4 5. Sales 6 Cost of sales 7 Total income 8 Other operating income 9 Provision for expected credit losses 10 Accompanying and marketing expenses 11 General and administrative expenses 12 Operating loss 13 (losses) profits from selling real estate machinery and equipment 14 financing costs 15 net share of buildings (loss) / profit of associates 16 Net loss before zakat 17 Zakat 18 Net loss 19 items Other comprehensive income 20 items that will not be reclassified later into profit or loss 21 Recalculation of employees' end of service benefits obligation 22 Net change in fair value 23 Other comprehensive income 24 Comprehensive total income 25 Earnings (loss) per share 26 27 28 2017 2018 2019 1,139,726 1,028,048 1,235,085 -971.457 -920.244 -908.511 168,269 107,804 326,574 10,742 12,381 13,783 -345 -15,420 -667 167.962 -175,429 181,908 -73.691 -89,746 -83.610 -62,987 - 160,410 74,172 5.628 -28 87 -40,316 -47.537 -59,875 721 -2971 656 -96,954 -210 946 21.040 -100 -9,658 - 18,569 -97,054-220,604 2,471 2,712 97 2.809 -94 245 (1.62) 1,307 730 2,037 -218.567 (3.58) -2,544 -87 -2.631 - 160 0.12