How much should Petrobras be willing to pay for Pecoms equity? Feel free to make adjustments and use any other methods of valuation to support your answer. Suppose there is a 10 percent chance that the Argentinian government will nationalize the project before the first years cash flows arrive, and a 10 percent chance it will do so every year after that (if it was not nationalized previously). Petrobras will get nothing if the project is nationalized. Your boss tells you that instead of haircutting cash flows to get the new NPV, she wants you to come up with a risk premium that you will add to the WACC arrived at to discount the original cash flows. What should that risk premium be?
Case:
Exhibits:
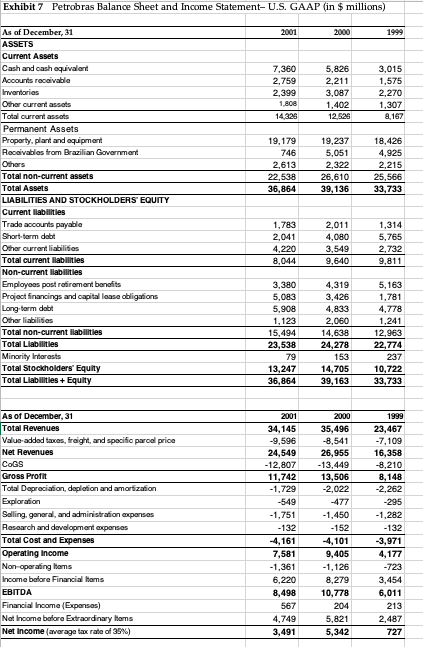
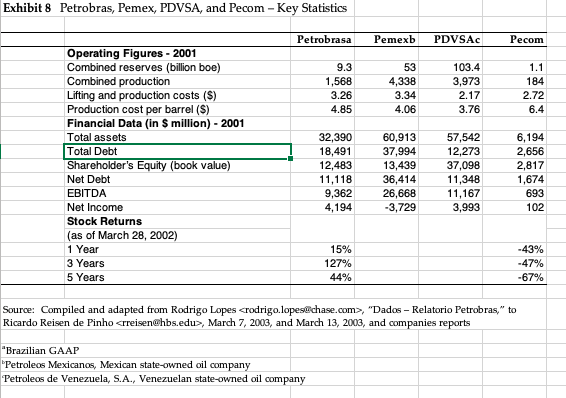
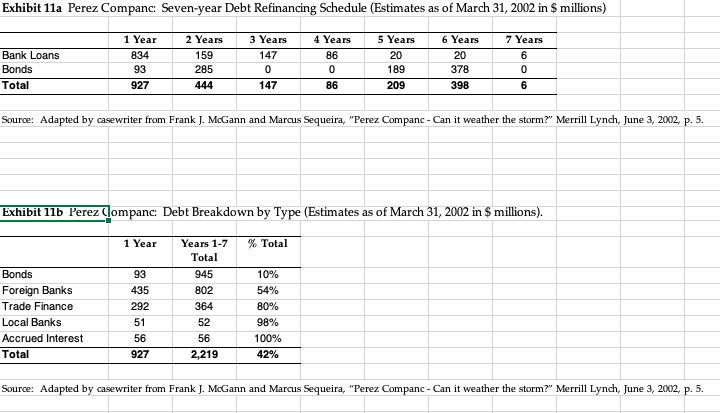
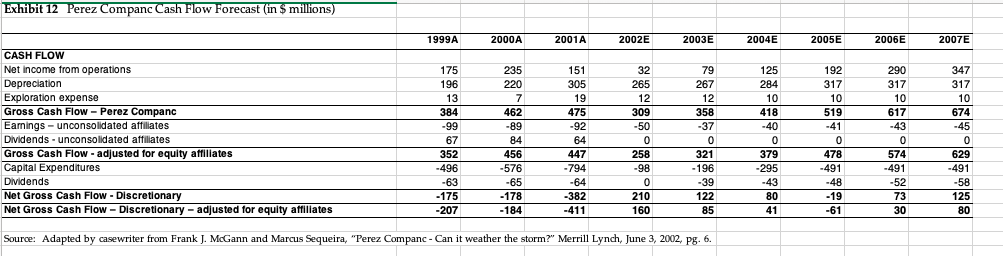
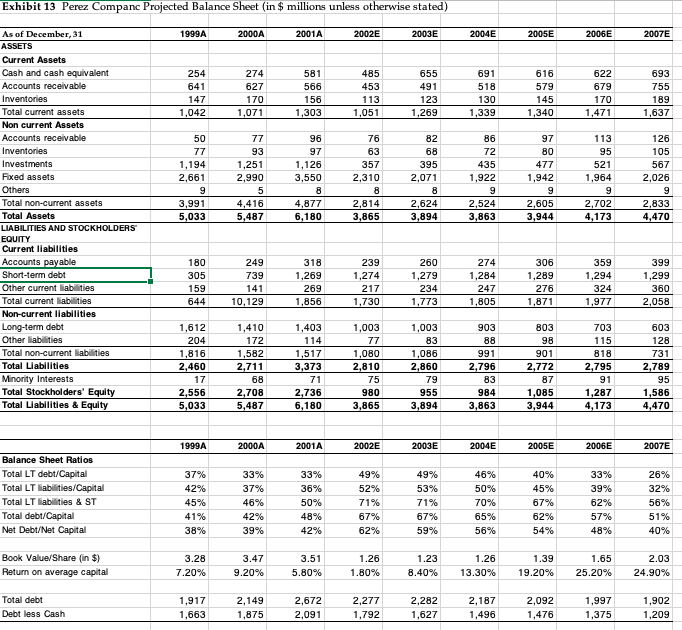
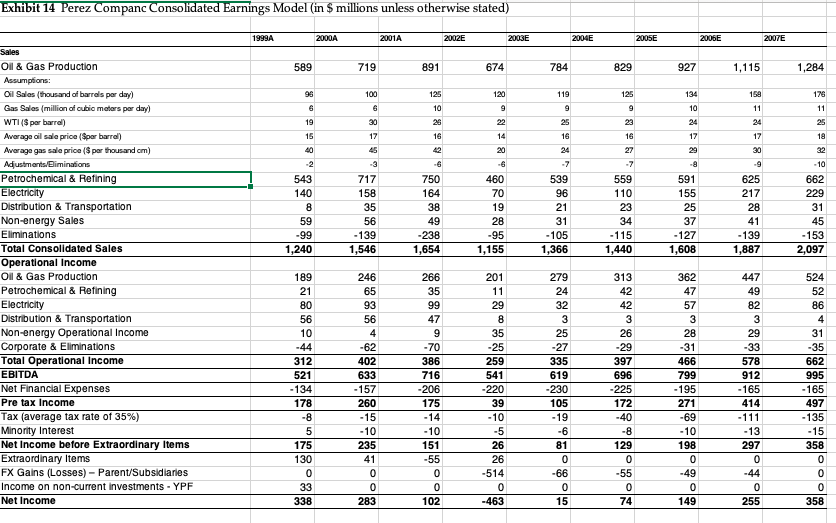

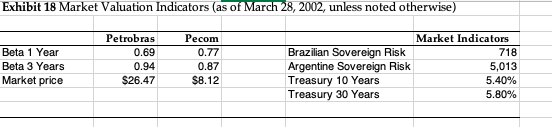
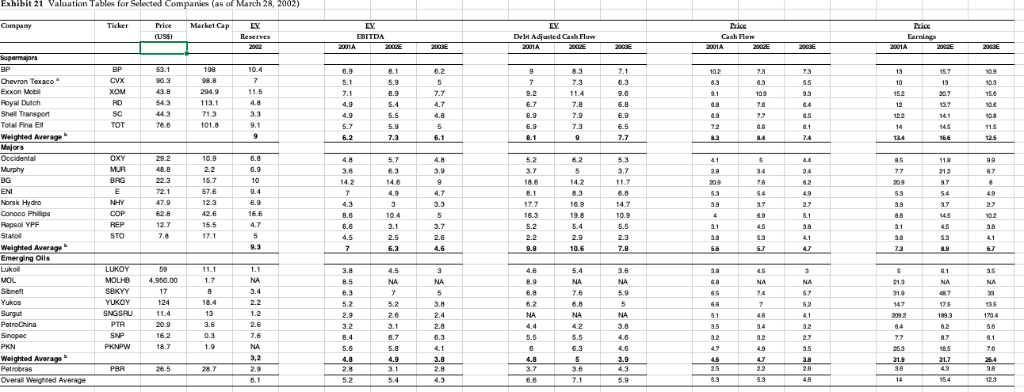
Drilling South: Petrobras Evaluates Pecom Nogueira Batista, Chief Financial Officer of the Brazilian firm Petrobras, reflected on Gros's words as prepared for a Board of Directors meeting in July 2002. The main item on the Board's agenda was the proposed acquisition of an Argentinean firm, the Perez Companc Group, or Pecom2The acquisition would s provide the mainly Brazilian-based Petrobras with considerable foreign interests. Petrobras would have access to Pecom's management team, which had worked in most of the major Latin American countries and under different operating environments, enhancing Petrobras's ability to manage an international ntly increase Petrobras's oil and gas production and add to its oil reserves. It would also Recent corporate governance changes meant that Petrobras now had more independence from the Brazilian government, and some managers were eager to explore new opportunities for the company including the possible acquisition of Pecom. Others were more cautious. General elections would be held in a few and one of the leading candidates for president, Luiz Inacio Lula da Silva of the Workers' Party, did not fully support Petrobras's increasing autonomy. If Lula won the election, Petrobras's new structure and its strategy could be challenged. At the same time, the acquisition of Pesom would give Petrobras's even m contribution to the Brazilian economy t and could increase the company's already substantial Batista had spent the previous weeks debating the merits of the acquisition and how to value Pecom with his team. There had been numerous discussions on the cost of capital for the acquisition, and especially on how to incorporate country risk given the current economic upheaval in Argentina. Uncertainty over the appropria approaches to the valuation, such as multiples. It was Batista's responsibility to present these different perspectives to the Board. The uncertainties inherent in valuing Pecom were bound to give rise to interesting discussions at the forthcoming Board meeting. te discount rate to use in a cash flow model led some team members to advocate other Petrobras Petrobras was created as a symbol of Brazil's natural wealth under the slogan "the oil is ours," in 1953. It was incorporated as a mixed-capital company3 with a government-granted monopoly for all crude oil and gas production, refining and distribution in Brazil. Petrobras's official monopoly ended in January 2002, when the Brazilian government deregulated domestic prices for crude oil and oil products. Petrobras's first discoveries were made onshore in the Northeast of Brazil in the 1950s and 1960s. In the mid 1980s, when the giant deepwater pools in the Campos Basin were discovered and developed, the profile of the company started to shift upstream toward exploration, development, and production. Upstream and Downstream Activities' By 2001, almost 50 years after its inception, Petrobras had become a fully integrated oil and gas company Petrobras was the seventh largest publicly traded oil and gas company in the world based upon proven reserves, the largest Brazilian corporation, the third largest Latin American corporation, and the 185 largest global comp any, by 2001 consolidated revenues In Brazil, Petrobras had a dominant position in both upstream and downstream activities. The company's combined oil and gas production was 1,621 tbpd and it had proven reserves estimated at around 9.3 billion boe(Exhibit 1 provides selected oil and gas data for Petrobras and other oil companies.) Most of the firm's proven reserves were located in very deep waters (more than 400 meters) and Petrobras was the world's pioneer in deep water oil exploration and production. Furthermore, with approximately 60% of its reserves undeveloped, Petrobras had a large pool of assets to engender long-term production In downstream activities, Petrobras was the fifth-largest refiner in the world among traded companies, with a virtual monopoly in the Brazilian downstream business. It owned and operated 11 out of 13 refineries in Brazil, accounting for 98.6% of the Brazilian refining capacity, Petrobras also owned the largest oil distribution company in Brazil. Exhibits 2 and 3 show the organization of the firm's main activities within its corporate and management structures. The Restructuring of Petrobras6 Until the late 1990s, the Brazilian government owned 84% of the voting shares of Petrobras and the Brazilian President a a market perception that several governments had used Petrobras as a tool to contain inflation or to advance development policies for specific industrial groups.1B independent of the president to Petrobras's shareholders, and the government was allowed to sell up to 34% of its voting shares in the capital markets. The government lifted restrictions on the ownership of shares by non- government entities and permitted foreign ownership of shares (see Exhibit 4 for major ownership and governance of Petrobras). In August 2000, Petrobras was listed on the NYSE t ADR Level II program, and in July 2002 it was listed on Latibex, the euro market for Latin American equity shares.8The shareholder structure of Petrobras is shown in Exhibit 5. ppointed the s Board and its executive directors. For many years, there was in 1997, Petrobras became more t. Responsibility for appointing the Board shifted from the Brazilian in the Another significant change affected Petrobras's financing strategy. Petrobras had played a key role in the government's fiscal policy. It was the largest Brazilian taxpayer, as well as the largest distributor of dividends and royalties. Petrobras's net profit represented almost 25% of the overall primary surplus of the consolidated public sector, or roughly 1% of the Brazilian GDP. Petrobras's capital expenditures were included in the government's budget and the company's investments and indebtedness were therefore subject to restrictions tied to the country's fiscal policy. From July 2002 on, The International Monetary Fund, or IMF, no longer considered Petrobras's investments part of the government's budget, thus removing any restrictions to its financing strategy Along with the changes in its ownership and control, Petrobras streamlined its management structure and implemented new management policies. The changes included the adoption of a new long-term strategic plan, the introduction of business units, the integration of some subsidiaries into the company as divisions to promote synergies and minimize functional overlaps, and the introduction of performance targets. Under the leadership of the current CEO, Francisco Gros, the company defined the role and responsibilities of the Board and the executive directors, created committees to advise top management, and issued guidelines for corporate governance, best practices and ethical conduct. The main objective of these changes was to transform Petrobras into a state-owned company able to compete with the same agility and freedom as a privately owned corporation. These changes appeared to be paying off. Statistical studies indicated that from 1999 to 2001, Petrobras migrated from a Brazil-risk stock, trading in close correlation with country risk, to something closer to a g company, reacting more to swings in crude oil prices. The market capitalization of Petrobras almost tripled during this period. Exhibit 6 provides data on the company's stock price history In 2001, on a consolidated basis, Petrobras's net revenues were $24.5 billion (see Exhibit 7 for Petrobras's financial statements). The company planned capital expenditures amounting to $28.2 billion through 2005, with 45% directed to exploration and production and 23% to international projects (not including potential acquisitions). The company's adjusted net debt of $11.1 billion gave a debt-to-total-capital ratio of 38%. Of the company's financial debt, 88% was denominated in foreign currency Petrobras' Strategy Some analysts judged that the recent changes in Petrobras's ownership and control and its new emphasis on a more flexible and responsive management structure put Petrobras in a different league from state- owned Latin American oil companies such as Pemex and PDVSA (see Exhibit 8 for key statistics on Petrobras and other Latin American oil companies). Alexandra Strommex, a J. P. Morgan senior analyst, explained: Petrobras had a very peculiar position within the oil industry. The company could not be considered a typical Latin American oil company like PDVSA or Pemex because it was already much more market- oriented and had more of a private-company mentality. Also, it was not a net exporter, focused on the external markets, but very much Brazil-centric. Additionally, despite its size, Petrobras did not seem to fit among the major oil companies, since it was not really global, even though it has a sizable integrated While Petrobras was not yet a glo Petrobras's stated objective was to build a Mexico, the Caribbean, and West Africa. The common theme behind that geographic focus was for Petrobras to leverage its deepwater expertise acquired in the Campos Basin. Moreover, since 95% of Petrobras's upstream reserves were exposed to the risks of a single country, Brazil, the company had a strong strategic rationale for enlarging its international activities. The acquisition of an Argentinean company was in line with Petrobras's strategy of expanding outside Brazil. l company, it as committed to geographic diversification. o of upstream assets in Latin America, the Gulf of Pecom The origins of Pecom went back to 1946, when the Perez Companc family incorporated the firm as a shipping company. However, it was only in 1960 that the company got involved in the oil business. Gradually, Pecom developed an appetite and skills for the oil industry and, in 1990, the company gained its first major oil concession. In 1994, Pecom took another important step when it started operations in Venezuela and then expanded into Brazil, Bolivia, Ecuador and Peru. In 1998 Pecom was consolidated as a vertically integrated energy company. The firm listed its shares on the Buenos Aires Stock Exchange in January 2000 and launched an ADR program on the New York Stock Exchange. Peso's corporate structure is shown in Exhibit 9 Upstream and Downstream Activities10 Peson's exploration and production activities were its main cash source, with drilling accounting for 69% of its adjusted EBITDA. Pegom's proven developed and undeveloped reserves were estimated around one billion beli About 42% of Recom's total reserves were in Argentina, and 58% were in operations in five other South American countries. Pecom forecast that its total production in 2005 would reach 400 tbed, with most of this coming from outs Pecoms interests represented just 7% of Besom's adjusted EBITDA as of December 2001, refining was a key part of Pecom's long-term strategy, representing an important link in the business value chain. Petrochemicals represented 8% of Peson's adjusted EBITDA in 2001 . It had the region's largest capacity for s polystyrene one-third share of the fertilizer market in Argentina. Among Pecom's other activities were its investment in TGS, the largest transporter of natural gas in Argentina, and interests in the generation, transmission, and distribution of electricity in Argentina. esom operated 75% of the country's high-voltage power m activities included refining operations in and Bolivia. Although these and was a leader in Argentina in these products. In addition, Pecom had over a had an exclusive license to serve both the residential population and commercial firms in the central and southern Buenos Aires Pecom and the Financial Crisis in Argentina Like many oil companies with hard, bankable assets, Pecom opted for relatively low-cost dollar borrowings in the 1990s, on the assumption that its primary products - crude, gas, and refined products would remain priced in dollars (see Exhibit 10 for Pesom's exposure to the domestic market and export opportunities). In July 2001, for instance, Deutsche Bank, a commercial bank, led a s underwrite Decoma four-year, $220 million unsecured floating rate note with a 9.3% all-in cost, ubstantially below the 16% Argentine sovereign bonds 12 ucts- of banks to In January 2002, however, the Argentine government abandoned its Convertibility Law, which fixed the Argentine peso at exactly one U.S. dollar and opted for a "pesification" of the economy. All U.S. dollar- denominated deposits in the financial system were converted at a rate of 1:1, while all U.S. dollar- denominated debts incurred in the Argentine financial system were converted at a rate of 1.40:1. The government decided to compensate financial institutions for the difference with a bond that had not yet been issued in July 2002. Firms that had incurred debt in U.S. dollars abroad were forced to cancel them through the open exchange rate market. On July 15, 2002, the U.S. dollar was quoted at ARS3.5 The financial crisis in Argentina had a severe impact on Pesom Less than 10% of Pesoms loans, and none of its foreign bond debt, were covered by the pesification. Pesom still faced mostly dollar- based debts, but revenues from some of its commercial agreements denominated in dollars and adjusted per the U.S. producer price index were converted into pesos at a 1:1 rate, and indexation was eliminated. These revenues were far below world market prices since devaluation Decom also faced a pending export tax that could be levied on up to 40% of the company's Argentine oil export revenue. In March 2002, Resom held $231 million in cash and short term investments and its debt and other financial obligations to the end of the year amounted to $840 million (see Exhibits 11a and 11b for Pecom's debt profile). Pecom's vice chairman, Oscar Vicente, painted a grim picture of Pecom's situation: "I have half or less of the pesos I need to buy the dollars I have to pay. A group like Perez Companc is not viable in this situation."13 domestic prices did not rise at the same rate as t Although the medium- and long-term business view was still promising, the short-term scenario had put the company at a crossroad. Pecom and its external advisors had been working on different alternatives the end of 2001, without a clear or easy solution. The company owned sound assets, but it could not simply divest selected assets without jeopardizing its longer-term growth prospects (see Exhibit 12, 13 and 14 for Pecom's actual and estimated financial statements). Simultaneously, the local banking system s in crisis and international bankers were reluctant to increase their exposure to an emerging market company. Pecom's management and shareholders had to come up with a solution before they were out of cash or credit. A senior analyst from Merrill Lynch explained: look at whether the company really does have the cash flow to continue to endure the It is necessary to crisis. Whatever the long-term cash-flow generation capability of the company, the ability to meet its debt maturities and interest payments is key to preserving equity value Petrobras's Proposed Acquisition of Pecom The acquisition of Pecom by Petrobras offered the Argentinean firm a solution to its current financial blem s and it was in line with Petrobras's strategy of geographic diversification. It was not clear owever, if the acquisition would be feasible. The deal would require regulatory approval, Argentina s in the midst of a financial crisis, and Brazil faced economic feared that the crisis continuing depreciation of the Brazilian Real against the US dollar (see Exhibit 15 for average monthl exchange rates). There was also considerable political uncertainty in Brazil because of the upcoming general elections in October 2002. Some businesses feared that the leading candidate for Inacio Lula da Silva of the Workers' Party, would change Brazil's existing economic and legal framework if elected president. A roll back of privatization, or at least a freeze on it, were among the Workers' Party's proposals, and it was not clear what impact this might have on Petrobras. ges of its own. Many Brazilians uld spread to their country and were concerned about the fiscal deficit and the wo Batista therefore faced a demanding task in evaluating the proposed acquisition of Pecom, The transaction initially envisioned by Petrobras's CEO Gros and Batista covered Petrobras's purchase of 58.6% of the total capital of Decom from the Perez Compans family and the Perez RmRans Foundation. In a separate transaction, Petrobras would also acquire 47.1% that the Perez Compans family held in Petrolera Perez Companc.15 Batista and his team prepared pro forma consolidated figures to detail the increases in oil and gas reserves and refining capacity that would be gained, and to show how the acquisition would affect debt and income (see Exhibits 16a for Pro Forma Operating Figures and Exhibit 16b for Pro Forma Financial Data) Valuation Approaches Batista had emphasized the need to build a cash flow model and run sensitivity analysis in the valuation of Pecom, The most complex issue confronting Batista was how to account for country risk in the cost of capital. Latin America's long tradition of economic and political instability exposed companies to a myriad of risk factors, including currency devaluation, repatriation, capital controls, and expropriation, but these risks changed over time and varied from country to country. Over the last decade, both Argentina and Brazil had embraced reforms backed by the International Monetary Fund (IMF) and the World Bank. Measures such as exchange rate stabilization, freer capital flow mechanisms, lower import tariffs to encourage trade, and privatization of state-owned companies were put into practice to pave the way toward integration with global economies.17 Argentina, however, was again in financial crisis, and determining the appropriate country risk premium to use for the Pesom valuation proved challenging for Batista and his team. Country risk (EMBI), with U.S. Treasury Bills of similar duration. As shown in Exhibit 17, Argentina and Brazil had similar country risk premiums up to mid-2001. By 2002, Argentina's country risk had increased so much that some team valuation was problematic (see Exhibit 18 for sovereign risk premiums and market valuation indicators) They suggested that the cost of capital could instead be derived from current analyst estimates of the s were most commonly derived from J. P. Morgan's Emerging Market Bond Index measured the spread between external sovereign debt instruments of markets argued that i g this risk premium into the discount rate for the Pecom average cost of capital for o il companies, including Petrobras and Pecom (see Exhibits 19a and 19b for cost of capital estimates), or from cost of equity estimates for different countries, including Brazil and Argentina (see Exhibit 20). Other team members, though, questioned how relevant such estimates were to the Pesom valuation. The uncertainty about the country risk premium and the appropriate cost of capital to use in a cash flow model led Batista and his team to consider other valuation approaches in their analysis. They compared the valuations of selected companies, examining t reserves, EBITDA, cash flow and earnings (see Exhibit 21). BOE multiples were another common valuation measure used in the oil recent transactions. BOE multiples, however, did vary considerably across transactions, and also according to the location of reserves, as shown in Exhibit 23. In analyzing the different market-based valuations, team members debated which companies were most comparable to Pecom and which transactions could usefully be compared to the proposed acquisition. Exhibit 22 provides information on the BOE multiples for Funding Strategy Another point the board would raise was the question of Petrobras's financing strategy for the acquisition. Funding the acquisition with cash, securities, or a combination of both would be a sensitive matter. Petrobras was a w Raising local funds meant paying high local interest rates with maturities shorter than 3 years. International markets were virtually closed to floating equity at that point could send a troublesome signal regarding Petrobras's current price truly reflecting its inherent equity value, thus jeopardizing the market expectation that Petrobras could lower its cost of capital, and name, but market conditions were deteriorating by July 2002 corpora te bonds coming from emerging markets.18 Finally 19 consequently boost future results and market performance. As Batista organized his notes for the Board meeting, he reflected on the issues he and his team had discussed in the previous weeks. Was the Pecom acquisition a sound opportunity to increase Petrobras's diversification, or was it a risky venture during an unsettled time? The price offered for Pesom would at least in part determine the answer, and Batista wanted to be sure that his valuation of Pesom provided the Board with the information it needed to make a decision. Exhibit 7 Petrobras Balance Sheet and Income Statement-U.S. GAAP (in$ millions) oqupment Rooaivablas from Brazilian Gowarnmant LIABILITIES AND STOCKHOLDERS EQUITY Emplayoos post roiramant banaits Projoct inancings and capital lease obligaions llabilties Total Stockholders' Equity Total Liabilities+Equity Valuo-addod taxos, fraight, and spocifio parod price Salling, ganaral, and administration axpanses Nat Income bafore Extraordinary Hams Net income avrage tax rate of 35%) Exhibit 8 Petrobras, Pemex, PDVSA, and Pecom - Statistics Petrobrasa Pemexb PDVSAc Pecom Operating Figures 2001 Combined reserves (billion boe) Combined production Lifting and production costs (S) Production cost per barrel (S) Financial Data (in S million)-2001 Total assets Total Debt Shareholder's Equity (book value) Net Debt EBITDA Net Income Stock Returns (as of March 28, 2002) 1 Year 3 Years 5 Years 9.3 1,568 3.26 4.85 103.4 3,973 2.17 3.76 4,338 3.34 4 184 2.72 6.4 32,39060,913 37,994 13,439 36,414 26,668 3,729 18,491 12,483 11,118 9,362 4,194 57,542 12,273 37,098 11,348 11,167 3,993 6,194 2,656 2,817 1,674 102 15% 127% 44% ,47% Source: Compiled and adapted from Rodrigo Lopes crodrigo.lopes@chase.com>, "Dados - Relatorio Petrobras," to Ricardo Reisen de Pinho
,March 7, 2003, and March 13, 2003, and companies reports Petroleos Mexicanos, Mexican state-owned oil company Petroleos de Venezuela, S.A., Venezuelan state-owned oil company Exhibit 11a Perez Companc: Seven-year Debt Refinancing Schedule (Estimates as of March 31, 2002 in $ millions) 1 Year 834 93 2 Years 3 Years 147 4 Years 5 Years 20 189 7 Years 6 Years 20 378 398 Bank Loans 159 285 Total 147 Source: Adapted by casewriter from Frank J. McGann and Marcus Sequeira, "Perez Companc- Can it weather the storm?" Merrill Lynch, June 3, 2002, p. 5. Exhibit Ilb Perez (lompanc: Debt Breakdown by Type (Estimates as of March 31,2002 in S millions) 1Year Years 1-7 %Total Total 945 802 10% 54% Foreign Banks Trade Finance Local Banks Accrued Interest Total 51 100% 2,219 Source: Adapted by casewriter from Frank J. McGann and Marcus Sequeira, "Perez Companc- Can it weather the storm?" Merrill Lynch, June 3, 2002, p. 5. rez Companc w Forecast (nmillions 2003E 2004E 2005E 2006E 2007E 1999A 2000A 2001A 2002E 192 317 10 519 .41 347 317 10 674 125 CASH FLOW Net income from operations Depreclation Exploration expense Gross Cash Flow - Perez Companc Eamings-unconsolidated affillates DiMidends-unconsoldated atfilates Gross Cash Flow - adjusted for equity affiliates Capital Expenditures Dividends Net Gross Cash Flow Discretionary Net Gross Cash Flow- Discretionary- adjusted for equity atfiliates 151 175 196 13 235 265 12 309 12 358 37 10 418 317 10 617 19 475 462 89 64 447 321 196 379 295 478 -491 574 -491 629 -491 258 456 576 65 178 184 352 73 125 175 207 210 160 122 85 19 -61 -411 Source: Adapted by casewriter from Frank J. McGann and Marcus Sequeira, "Perez Companc- Can it weather the storm?" Merrill Lynch, June 3, 2002, pg. 6. Exhibit 13 Perez Companc Projected Balance Sheet(in $ millions unlesso As of December,31 2001A Current Assets Cash and cash equivalent Accounts receivable 274 627 655 693 755 566 453 Total current assets Non current Assets Accounts receivable Inventories Investments Fixed assets 1,303 1,269 1,339 1,637 50 96 76 72 95 357 395 1,942 2,026 Total non-current assets Total Assets 4,877 2,624 3,894 2,524 3,863 2.605 2,702 2.833 4,470 5,033 5,487 3,865 Current liabilities 249 239 260 274 ,284 247 359 399 -term debt Other current abil ities Total current Cabilities Non-current liabilities 269 1,856 234 276 324 360 2,058 603 10,129 1.730 803 Other abilities 1582 1,080 1.086 2,860 Total Liabilitles Minority Interests Total Stockholders' Equity Total Liabilities & Equity 2,460 3,373 2,796 2,795 2,789 2,556 5,033 980 3,865 984 3,863 1,085 3,944 1,287 1,586 4,470 5,487 3,894 2000A 2001A Balance Sheet Ratios Total LT debt/Capital Total LT iabilities/Capital Total LT abi ties& ST Total debt/Capital Net Debt/Net Capital 49% 52% 37% 33% 37% 33% 49% 33% 39% 62% 57% 48% 26% 32% 50% 45% 67% 62% 45% 42% 39% 67% 62% 67% 59% 65% 42% 56% Book ValuelShare (n $) on average capital 1.80% 19.20% 25.20% 24.90% Total debt 2,092 1,476 Debt less Cash 1,663 1,627 1,496 1,209 Exhibit 21 Valuation Tables for Selected Companies (as of March 28, 2002 Price Market Ca EY Debt Adjuted Cash Flow Cash low Shell Transport Conoco Ph pa Drilling South: Petrobras Evaluates Pecom Nogueira Batista, Chief Financial Officer of the Brazilian firm Petrobras, reflected on Gros's words as prepared for a Board of Directors meeting in July 2002. The main item on the Board's agenda was the proposed acquisition of an Argentinean firm, the Perez Companc Group, or Pecom2The acquisition would s provide the mainly Brazilian-based Petrobras with considerable foreign interests. Petrobras would have access to Pecom's management team, which had worked in most of the major Latin American countries and under different operating environments, enhancing Petrobras's ability to manage an international ntly increase Petrobras's oil and gas production and add to its oil reserves. It would also Recent corporate governance changes meant that Petrobras now had more independence from the Brazilian government, and some managers were eager to explore new opportunities for the company including the possible acquisition of Pecom. Others were more cautious. General elections would be held in a few and one of the leading candidates for president, Luiz Inacio Lula da Silva of the Workers' Party, did not fully support Petrobras's increasing autonomy. If Lula won the election, Petrobras's new structure and its strategy could be challenged. At the same time, the acquisition of Pesom would give Petrobras's even m contribution to the Brazilian economy t and could increase the company's already substantial Batista had spent the previous weeks debating the merits of the acquisition and how to value Pecom with his team. There had been numerous discussions on the cost of capital for the acquisition, and especially on how to incorporate country risk given the current economic upheaval in Argentina. Uncertainty over the appropria approaches to the valuation, such as multiples. It was Batista's responsibility to present these different perspectives to the Board. The uncertainties inherent in valuing Pecom were bound to give rise to interesting discussions at the forthcoming Board meeting. te discount rate to use in a cash flow model led some team members to advocate other Petrobras Petrobras was created as a symbol of Brazil's natural wealth under the slogan "the oil is ours," in 1953. It was incorporated as a mixed-capital company3 with a government-granted monopoly for all crude oil and gas production, refining and distribution in Brazil. Petrobras's official monopoly ended in January 2002, when the Brazilian government deregulated domestic prices for crude oil and oil products. Petrobras's first discoveries were made onshore in the Northeast of Brazil in the 1950s and 1960s. In the mid 1980s, when the giant deepwater pools in the Campos Basin were discovered and developed, the profile of the company started to shift upstream toward exploration, development, and production. Upstream and Downstream Activities' By 2001, almost 50 years after its inception, Petrobras had become a fully integrated oil and gas company Petrobras was the seventh largest publicly traded oil and gas company in the world based upon proven reserves, the largest Brazilian corporation, the third largest Latin American corporation, and the 185 largest global comp any, by 2001 consolidated revenues In Brazil, Petrobras had a dominant position in both upstream and downstream activities. The company's combined oil and gas production was 1,621 tbpd and it had proven reserves estimated at around 9.3 billion boe(Exhibit 1 provides selected oil and gas data for Petrobras and other oil companies.) Most of the firm's proven reserves were located in very deep waters (more than 400 meters) and Petrobras was the world's pioneer in deep water oil exploration and production. Furthermore, with approximately 60% of its reserves undeveloped, Petrobras had a large pool of assets to engender long-term production In downstream activities, Petrobras was the fifth-largest refiner in the world among traded companies, with a virtual monopoly in the Brazilian downstream business. It owned and operated 11 out of 13 refineries in Brazil, accounting for 98.6% of the Brazilian refining capacity, Petrobras also owned the largest oil distribution company in Brazil. Exhibits 2 and 3 show the organization of the firm's main activities within its corporate and management structures. The Restructuring of Petrobras6 Until the late 1990s, the Brazilian government owned 84% of the voting shares of Petrobras and the Brazilian President a a market perception that several governments had used Petrobras as a tool to contain inflation or to advance development policies for specific industrial groups.1B independent of the president to Petrobras's shareholders, and the government was allowed to sell up to 34% of its voting shares in the capital markets. The government lifted restrictions on the ownership of shares by non- government entities and permitted foreign ownership of shares (see Exhibit 4 for major ownership and governance of Petrobras). In August 2000, Petrobras was listed on the NYSE t ADR Level II program, and in July 2002 it was listed on Latibex, the euro market for Latin American equity shares.8The shareholder structure of Petrobras is shown in Exhibit 5. ppointed the s Board and its executive directors. For many years, there was in 1997, Petrobras became more t. Responsibility for appointing the Board shifted from the Brazilian in the Another significant change affected Petrobras's financing strategy. Petrobras had played a key role in the government's fiscal policy. It was the largest Brazilian taxpayer, as well as the largest distributor of dividends and royalties. Petrobras's net profit represented almost 25% of the overall primary surplus of the consolidated public sector, or roughly 1% of the Brazilian GDP. Petrobras's capital expenditures were included in the government's budget and the company's investments and indebtedness were therefore subject to restrictions tied to the country's fiscal policy. From July 2002 on, The International Monetary Fund, or IMF, no longer considered Petrobras's investments part of the government's budget, thus removing any restrictions to its financing strategy Along with the changes in its ownership and control, Petrobras streamlined its management structure and implemented new management policies. The changes included the adoption of a new long-term strategic plan, the introduction of business units, the integration of some subsidiaries into the company as divisions to promote synergies and minimize functional overlaps, and the introduction of performance targets. Under the leadership of the current CEO, Francisco Gros, the company defined the role and responsibilities of the Board and the executive directors, created committees to advise top management, and issued guidelines for corporate governance, best practices and ethical conduct. The main objective of these changes was to transform Petrobras into a state-owned company able to compete with the same agility and freedom as a privately owned corporation. These changes appeared to be paying off. Statistical studies indicated that from 1999 to 2001, Petrobras migrated from a Brazil-risk stock, trading in close correlation with country risk, to something closer to a g company, reacting more to swings in crude oil prices. The market capitalization of Petrobras almost tripled during this period. Exhibit 6 provides data on the company's stock price history In 2001, on a consolidated basis, Petrobras's net revenues were $24.5 billion (see Exhibit 7 for Petrobras's financial statements). The company planned capital expenditures amounting to $28.2 billion through 2005, with 45% directed to exploration and production and 23% to international projects (not including potential acquisitions). The company's adjusted net debt of $11.1 billion gave a debt-to-total-capital ratio of 38%. Of the company's financial debt, 88% was denominated in foreign currency Petrobras' Strategy Some analysts judged that the recent changes in Petrobras's ownership and control and its new emphasis on a more flexible and responsive management structure put Petrobras in a different league from state- owned Latin American oil companies such as Pemex and PDVSA (see Exhibit 8 for key statistics on Petrobras and other Latin American oil companies). Alexandra Strommex, a J. P. Morgan senior analyst, explained: Petrobras had a very peculiar position within the oil industry. The company could not be considered a typical Latin American oil company like PDVSA or Pemex because it was already much more market- oriented and had more of a private-company mentality. Also, it was not a net exporter, focused on the external markets, but very much Brazil-centric. Additionally, despite its size, Petrobras did not seem to fit among the major oil companies, since it was not really global, even though it has a sizable integrated While Petrobras was not yet a glo Petrobras's stated objective was to build a Mexico, the Caribbean, and West Africa. The common theme behind that geographic focus was for Petrobras to leverage its deepwater expertise acquired in the Campos Basin. Moreover, since 95% of Petrobras's upstream reserves were exposed to the risks of a single country, Brazil, the company had a strong strategic rationale for enlarging its international activities. The acquisition of an Argentinean company was in line with Petrobras's strategy of expanding outside Brazil. l company, it as committed to geographic diversification. o of upstream assets in Latin America, the Gulf of Pecom The origins of Pecom went back to 1946, when the Perez Companc family incorporated the firm as a shipping company. However, it was only in 1960 that the company got involved in the oil business. Gradually, Pecom developed an appetite and skills for the oil industry and, in 1990, the company gained its first major oil concession. In 1994, Pecom took another important step when it started operations in Venezuela and then expanded into Brazil, Bolivia, Ecuador and Peru. In 1998 Pecom was consolidated as a vertically integrated energy company. The firm listed its shares on the Buenos Aires Stock Exchange in January 2000 and launched an ADR program on the New York Stock Exchange. Peso's corporate structure is shown in Exhibit 9 Upstream and Downstream Activities10 Peson's exploration and production activities were its main cash source, with drilling accounting for 69% of its adjusted EBITDA. Pegom's proven developed and undeveloped reserves were estimated around one billion beli About 42% of Recom's total reserves were in Argentina, and 58% were in operations in five other South American countries. Pecom forecast that its total production in 2005 would reach 400 tbed, with most of this coming from outs Pecoms interests represented just 7% of Besom's adjusted EBITDA as of December 2001, refining was a key part of Pecom's long-term strategy, representing an important link in the business value chain. Petrochemicals represented 8% of Peson's adjusted EBITDA in 2001 . It had the region's largest capacity for s polystyrene one-third share of the fertilizer market in Argentina. Among Pecom's other activities were its investment in TGS, the largest transporter of natural gas in Argentina, and interests in the generation, transmission, and distribution of electricity in Argentina. esom operated 75% of the country's high-voltage power m activities included refining operations in and Bolivia. Although these and was a leader in Argentina in these products. In addition, Pecom had over a had an exclusive license to serve both the residential population and commercial firms in the central and southern Buenos Aires Pecom and the Financial Crisis in Argentina Like many oil companies with hard, bankable assets, Pecom opted for relatively low-cost dollar borrowings in the 1990s, on the assumption that its primary products - crude, gas, and refined products would remain priced in dollars (see Exhibit 10 for Pesom's exposure to the domestic market and export opportunities). In July 2001, for instance, Deutsche Bank, a commercial bank, led a s underwrite Decoma four-year, $220 million unsecured floating rate note with a 9.3% all-in cost, ubstantially below the 16% Argentine sovereign bonds 12 ucts- of banks to In January 2002, however, the Argentine government abandoned its Convertibility Law, which fixed the Argentine peso at exactly one U.S. dollar and opted for a "pesification" of the economy. All U.S. dollar- denominated deposits in the financial system were converted at a rate of 1:1, while all U.S. dollar- denominated debts incurred in the Argentine financial system were converted at a rate of 1.40:1. The government decided to compensate financial institutions for the difference with a bond that had not yet been issued in July 2002. Firms that had incurred debt in U.S. dollars abroad were forced to cancel them through the open exchange rate market. On July 15, 2002, the U.S. dollar was quoted at ARS3.5 The financial crisis in Argentina had a severe impact on Pesom Less than 10% of Pesoms loans, and none of its foreign bond debt, were covered by the pesification. Pesom still faced mostly dollar- based debts, but revenues from some of its commercial agreements denominated in dollars and adjusted per the U.S. producer price index were converted into pesos at a 1:1 rate, and indexation was eliminated. These revenues were far below world market prices since devaluation Decom also faced a pending export tax that could be levied on up to 40% of the company's Argentine oil export revenue. In March 2002, Resom held $231 million in cash and short term investments and its debt and other financial obligations to the end of the year amounted to $840 million (see Exhibits 11a and 11b for Pecom's debt profile). Pecom's vice chairman, Oscar Vicente, painted a grim picture of Pecom's situation: "I have half or less of the pesos I need to buy the dollars I have to pay. A group like Perez Companc is not viable in this situation."13 domestic prices did not rise at the same rate as t Although the medium- and long-term business view was still promising, the short-term scenario had put the company at a crossroad. Pecom and its external advisors had been working on different alternatives the end of 2001, without a clear or easy solution. The company owned sound assets, but it could not simply divest selected assets without jeopardizing its longer-term growth prospects (see Exhibit 12, 13 and 14 for Pecom's actual and estimated financial statements). Simultaneously, the local banking system s in crisis and international bankers were reluctant to increase their exposure to an emerging market company. Pecom's management and shareholders had to come up with a solution before they were out of cash or credit. A senior analyst from Merrill Lynch explained: look at whether the company really does have the cash flow to continue to endure the It is necessary to crisis. Whatever the long-term cash-flow generation capability of the company, the ability to meet its debt maturities and interest payments is key to preserving equity value Petrobras's Proposed Acquisition of Pecom The acquisition of Pecom by Petrobras offered the Argentinean firm a solution to its current financial blem s and it was in line with Petrobras's strategy of geographic diversification. It was not clear owever, if the acquisition would be feasible. The deal would require regulatory approval, Argentina s in the midst of a financial crisis, and Brazil faced economic feared that the crisis continuing depreciation of the Brazilian Real against the US dollar (see Exhibit 15 for average monthl exchange rates). There was also considerable political uncertainty in Brazil because of the upcoming general elections in October 2002. Some businesses feared that the leading candidate for Inacio Lula da Silva of the Workers' Party, would change Brazil's existing economic and legal framework if elected president. A roll back of privatization, or at least a freeze on it, were among the Workers' Party's proposals, and it was not clear what impact this might have on Petrobras. ges of its own. Many Brazilians uld spread to their country and were concerned about the fiscal deficit and the wo Batista therefore faced a demanding task in evaluating the proposed acquisition of Pecom, The transaction initially envisioned by Petrobras's CEO Gros and Batista covered Petrobras's purchase of 58.6% of the total capital of Decom from the Perez Compans family and the Perez RmRans Foundation. In a separate transaction, Petrobras would also acquire 47.1% that the Perez Compans family held in Petrolera Perez Companc.15 Batista and his team prepared pro forma consolidated figures to detail the increases in oil and gas reserves and refining capacity that would be gained, and to show how the acquisition would affect debt and income (see Exhibits 16a for Pro Forma Operating Figures and Exhibit 16b for Pro Forma Financial Data) Valuation Approaches Batista had emphasized the need to build a cash flow model and run sensitivity analysis in the valuation of Pecom, The most complex issue confronting Batista was how to account for country risk in the cost of capital. Latin America's long tradition of economic and political instability exposed companies to a myriad of risk factors, including currency devaluation, repatriation, capital controls, and expropriation, but these risks changed over time and varied from country to country. Over the last decade, both Argentina and Brazil had embraced reforms backed by the International Monetary Fund (IMF) and the World Bank. Measures such as exchange rate stabilization, freer capital flow mechanisms, lower import tariffs to encourage trade, and privatization of state-owned companies were put into practice to pave the way toward integration with global economies.17 Argentina, however, was again in financial crisis, and determining the appropriate country risk premium to use for the Pesom valuation proved challenging for Batista and his team. Country risk (EMBI), with U.S. Treasury Bills of similar duration. As shown in Exhibit 17, Argentina and Brazil had similar country risk premiums up to mid-2001. By 2002, Argentina's country risk had increased so much that some team valuation was problematic (see Exhibit 18 for sovereign risk premiums and market valuation indicators) They suggested that the cost of capital could instead be derived from current analyst estimates of the s were most commonly derived from J. P. Morgan's Emerging Market Bond Index measured the spread between external sovereign debt instruments of markets argued that i g this risk premium into the discount rate for the Pecom average cost of capital for o il companies, including Petrobras and Pecom (see Exhibits 19a and 19b for cost of capital estimates), or from cost of equity estimates for different countries, including Brazil and Argentina (see Exhibit 20). Other team members, though, questioned how relevant such estimates were to the Pesom valuation. The uncertainty about the country risk premium and the appropriate cost of capital to use in a cash flow model led Batista and his team to consider other valuation approaches in their analysis. They compared the valuations of selected companies, examining t reserves, EBITDA, cash flow and earnings (see Exhibit 21). BOE multiples were another common valuation measure used in the oil recent transactions. BOE multiples, however, did vary considerably across transactions, and also according to the location of reserves, as shown in Exhibit 23. In analyzing the different market-based valuations, team members debated which companies were most comparable to Pecom and which transactions could usefully be compared to the proposed acquisition. Exhibit 22 provides information on the BOE multiples for Funding Strategy Another point the board would raise was the question of Petrobras's financing strategy for the acquisition. Funding the acquisition with cash, securities, or a combination of both would be a sensitive matter. Petrobras was a w Raising local funds meant paying high local interest rates with maturities shorter than 3 years. International markets were virtually closed to floating equity at that point could send a troublesome signal regarding Petrobras's current price truly reflecting its inherent equity value, thus jeopardizing the market expectation that Petrobras could lower its cost of capital, and name, but market conditions were deteriorating by July 2002 corpora te bonds coming from emerging markets.18 Finally 19 consequently boost future results and market performance. As Batista organized his notes for the Board meeting, he reflected on the issues he and his team had discussed in the previous weeks. Was the Pecom acquisition a sound opportunity to increase Petrobras's diversification, or was it a risky venture during an unsettled time? The price offered for Pesom would at least in part determine the answer, and Batista wanted to be sure that his valuation of Pesom provided the Board with the information it needed to make a decision. Exhibit 7 Petrobras Balance Sheet and Income Statement-U.S. GAAP (in$ millions) oqupment Rooaivablas from Brazilian Gowarnmant LIABILITIES AND STOCKHOLDERS EQUITY Emplayoos post roiramant banaits Projoct inancings and capital lease obligaions llabilties Total Stockholders' Equity Total Liabilities+Equity Valuo-addod taxos, fraight, and spocifio parod price Salling, ganaral, and administration axpanses Nat Income bafore Extraordinary Hams Net income avrage tax rate of 35%) Exhibit 8 Petrobras, Pemex, PDVSA, and Pecom - Statistics Petrobrasa Pemexb PDVSAc Pecom Operating Figures 2001 Combined reserves (billion boe) Combined production Lifting and production costs (S) Production cost per barrel (S) Financial Data (in S million)-2001 Total assets Total Debt Shareholder's Equity (book value) Net Debt EBITDA Net Income Stock Returns (as of March 28, 2002) 1 Year 3 Years 5 Years 9.3 1,568 3.26 4.85 103.4 3,973 2.17 3.76 4,338 3.34 4 184 2.72 6.4 32,39060,913 37,994 13,439 36,414 26,668 3,729 18,491 12,483 11,118 9,362 4,194 57,542 12,273 37,098 11,348 11,167 3,993 6,194 2,656 2,817 1,674 102 15% 127% 44% ,47% Source: Compiled and adapted from Rodrigo Lopes crodrigo.lopes@chase.com>, "Dados - Relatorio Petrobras," to Ricardo Reisen de Pinho ,March 7, 2003, and March 13, 2003, and companies reports Petroleos Mexicanos, Mexican state-owned oil company Petroleos de Venezuela, S.A., Venezuelan state-owned oil company Exhibit 11a Perez Companc: Seven-year Debt Refinancing Schedule (Estimates as of March 31, 2002 in $ millions) 1 Year 834 93 2 Years 3 Years 147 4 Years 5 Years 20 189 7 Years 6 Years 20 378 398 Bank Loans 159 285 Total 147 Source: Adapted by casewriter from Frank J. McGann and Marcus Sequeira, "Perez Companc- Can it weather the storm?" Merrill Lynch, June 3, 2002, p. 5. Exhibit Ilb Perez (lompanc: Debt Breakdown by Type (Estimates as of March 31,2002 in S millions) 1Year Years 1-7 %Total Total 945 802 10% 54% Foreign Banks Trade Finance Local Banks Accrued Interest Total 51 100% 2,219 Source: Adapted by casewriter from Frank J. McGann and Marcus Sequeira, "Perez Companc- Can it weather the storm?" Merrill Lynch, June 3, 2002, p. 5. rez Companc w Forecast (nmillions 2003E 2004E 2005E 2006E 2007E 1999A 2000A 2001A 2002E 192 317 10 519 .41 347 317 10 674 125 CASH FLOW Net income from operations Depreclation Exploration expense Gross Cash Flow - Perez Companc Eamings-unconsolidated affillates DiMidends-unconsoldated atfilates Gross Cash Flow - adjusted for equity affiliates Capital Expenditures Dividends Net Gross Cash Flow Discretionary Net Gross Cash Flow- Discretionary- adjusted for equity atfiliates 151 175 196 13 235 265 12 309 12 358 37 10 418 317 10 617 19 475 462 89 64 447 321 196 379 295 478 -491 574 -491 629 -491 258 456 576 65 178 184 352 73 125 175 207 210 160 122 85 19 -61 -411 Source: Adapted by casewriter from Frank J. McGann and Marcus Sequeira, "Perez Companc- Can it weather the storm?" Merrill Lynch, June 3, 2002, pg. 6. Exhibit 13 Perez Companc Projected Balance Sheet(in $ millions unlesso As of December,31 2001A Current Assets Cash and cash equivalent Accounts receivable 274 627 655 693 755 566 453 Total current assets Non current Assets Accounts receivable Inventories Investments Fixed assets 1,303 1,269 1,339 1,637 50 96 76 72 95 357 395 1,942 2,026 Total non-current assets Total Assets 4,877 2,624 3,894 2,524 3,863 2.605 2,702 2.833 4,470 5,033 5,487 3,865 Current liabilities 249 239 260 274 ,284 247 359 399 -term debt Other current abil ities Total current Cabilities Non-current liabilities 269 1,856 234 276 324 360 2,058 603 10,129 1.730 803 Other abilities 1582 1,080 1.086 2,860 Total Liabilitles Minority Interests Total Stockholders' Equity Total Liabilities & Equity 2,460 3,373 2,796 2,795 2,789 2,556 5,033 980 3,865 984 3,863 1,085 3,944 1,287 1,586 4,470 5,487 3,894 2000A 2001A Balance Sheet Ratios Total LT debt/Capital Total LT iabilities/Capital Total LT abi ties& ST Total debt/Capital Net Debt/Net Capital 49% 52% 37% 33% 37% 33% 49% 33% 39% 62% 57% 48% 26% 32% 50% 45% 67% 62% 45% 42% 39% 67% 62% 67% 59% 65% 42% 56% Book ValuelShare (n $) on average capital 1.80% 19.20% 25.20% 24.90% Total debt 2,092 1,476 Debt less Cash 1,663 1,627 1,496 1,209 Exhibit 21 Valuation Tables for Selected Companies (as of March 28, 2002 Price Market Ca EY Debt Adjuted Cash Flow Cash low Shell Transport Conoco Ph pa