

Answered step by step
Verified Expert Solution
Question
1 Approved Answer
Thank you for helping me, please can you show or write the excel formula to understand it. X fir Problem 12-12 E F A A
Thank you for helping me, please can you show or write the excel formula to understand it.
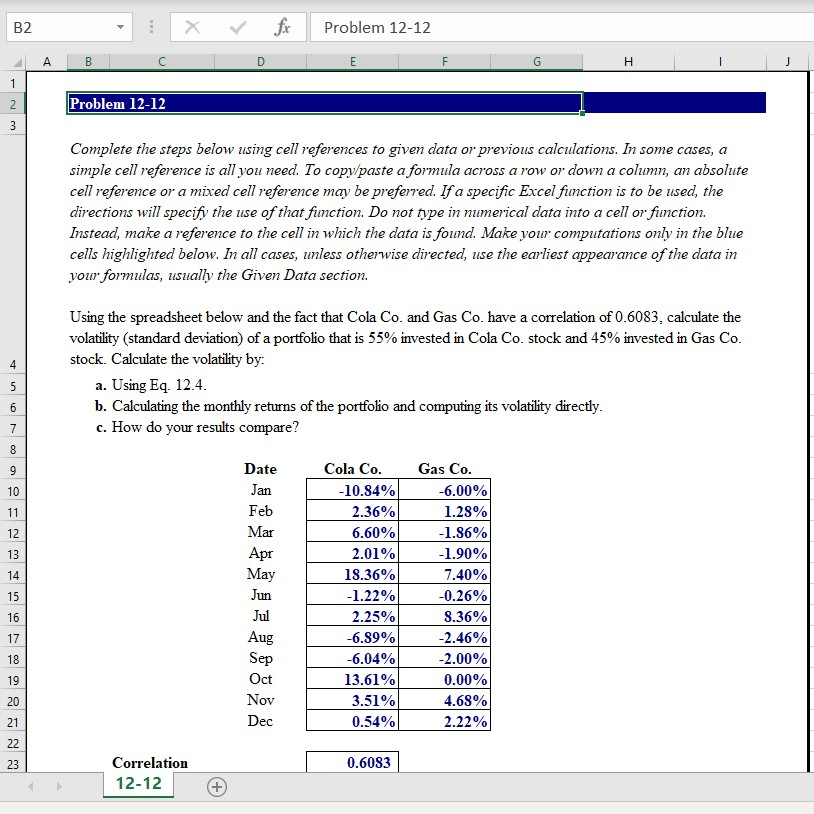
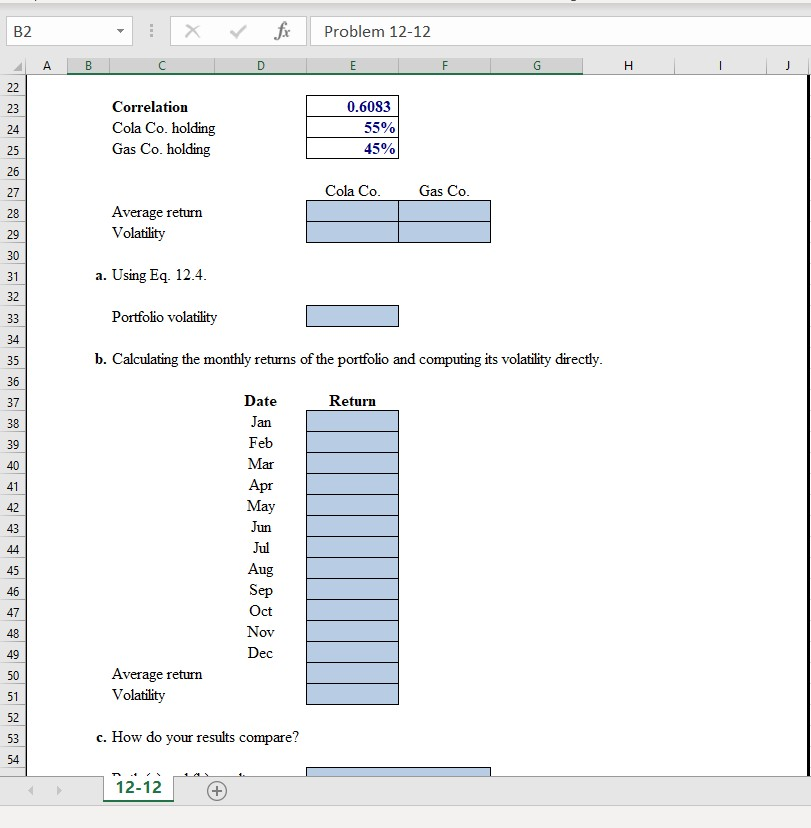
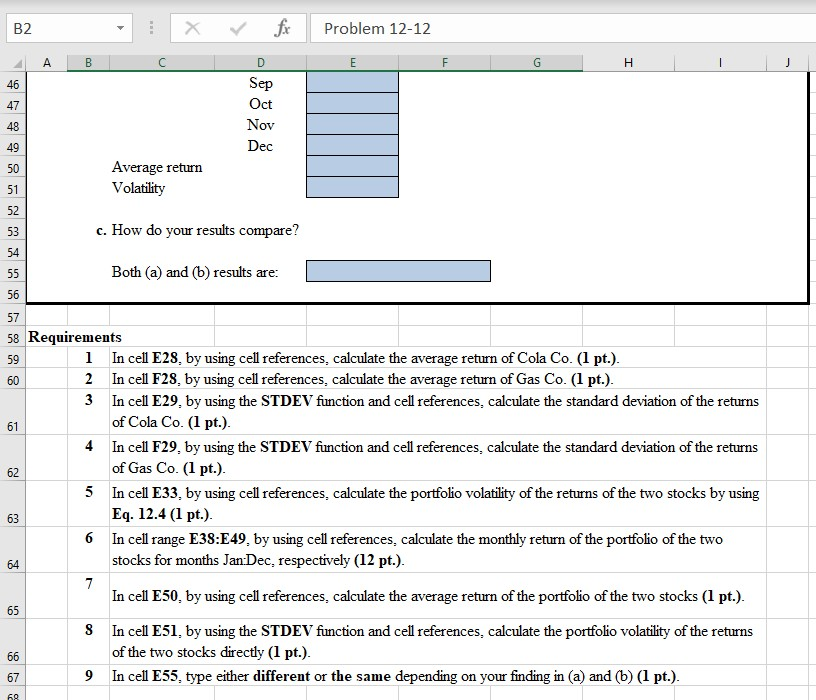
X fir Problem 12-12 E F A A B C D G H I J Problem 12-12 Complete the steps below using cell references to given data or previous calculations. In some cases, a simple cell reference is all you need. To copy paste a formula across a row or down a column, an absolute cell reference or a mixed cell reference may be preferred. If a specific Excel function is to be used, the directions will specify the use of that function. Do not type in numerical data into a cell or function Instead, make a reference to the cell in which the data is found. Make your computations only in the blue cells highlighted below. In all cases, unless otherwise directed, use the earliest appearance of the data in your formulas, usually the Given Data section. Using the spreadsheet below and the fact that Cola Co. and Gas Co. have a correlation of 0.6083, calculate the volatility (standard deviation of a portfolio that is 55% invested in Cola Co. stock and 45% invested in Gas Co. stock. Calculate the volatility by: a. Using Eq. 12.4. b. Calculating the monthly returns of the portfolio and computing its volatility directly. c. How do your results compare? Date Jan Feb Cola Co. -10.84% 2.36% 6.60% 2.01% 18.36% -1.22% 2.25% -6.89% -6.04% 13.61% 3.51% 0.54% Gas Co. -6.00% 1.28% -1.86% -1.90% 7.40% -0.26% 8.36% -2.46% -2.00% 0.00% 4.68% 2.22% Oct Dec 0.6083 Correlation 12-12 fir Problem 12-12 A B C D E F G H Correlation Cola Co. holding Gas Co. holding 0.6083 55% 45% Cola Co. Gas Co. Average return Volatility a. Using Eq. 12.4. Portfolio volatility b. Calculating the monthly returns of the portfolio and computing its volatility directly. Date Return Jan Feb Mar Apr May Aug Sep Oct Dec Average return Volatility c. How do your results compare? 12-12 - fr Problem 12-12 A B C D E F G H I J Sep Oct Nov Dec Average return Volatility c. How do your results compare? Both (a) and (b) results are: 58 Requirements 1 In cell E28, by using cell references, calculate the average return of Cola Co. (1 pt.). 2 In cell F28, by using cell references, calculate the average return of Gas Co. (1 pt.). 3 In cell E29. by using the STDEV function and cell references, calculate the standard deviation of the returns of Cola Co. (1 pt.). 4 In cell F29, by using the STDEV function and cell references, calculate the standard deviation of the returns of Gas Co. (1 pt.). 5 In cell E33, by using cell references, calculate the portfolio volatility of the returns of the two stocks by using Eq. 12.4 (1 pt.). 6 In cell range E38:E49, by using cell references, calculate the monthly return of the portfolio of the two stocks for months Jan:Dec, respectively (12 pt.). In cell E50, by using cell references, calculate the average return of the portfolio of the two stocks (1 pt.). 8 In cell E51, by using the STDEV function and cell references, calculate the portfolio volatility of the returns of the two stocks directly (1 pt.). In cell E55, type either different or the same depending on your finding in (a) and (b) (1 pt.). 9Step by Step Solution
There are 3 Steps involved in it
Step: 1

Get Instant Access to Expert-Tailored Solutions
See step-by-step solutions with expert insights and AI powered tools for academic success
Step: 2

Step: 3
Ace Your Homework with AI
Get the answers you need in no time with our AI-driven, step-by-step assistance
Get Started
Corporate Finance Investment And Advisory Applications
Authors: Jesse McDougall, Patrick Boyle
1st Edition
1530116597, 9781530116591