How to create a pro forma income statement and balance sheet? If someone could explain how I could go about forecasting three years in the future. The company I have to do this for is monarch casino and resort. This is all the information I have. What else do I need to accomplish this?
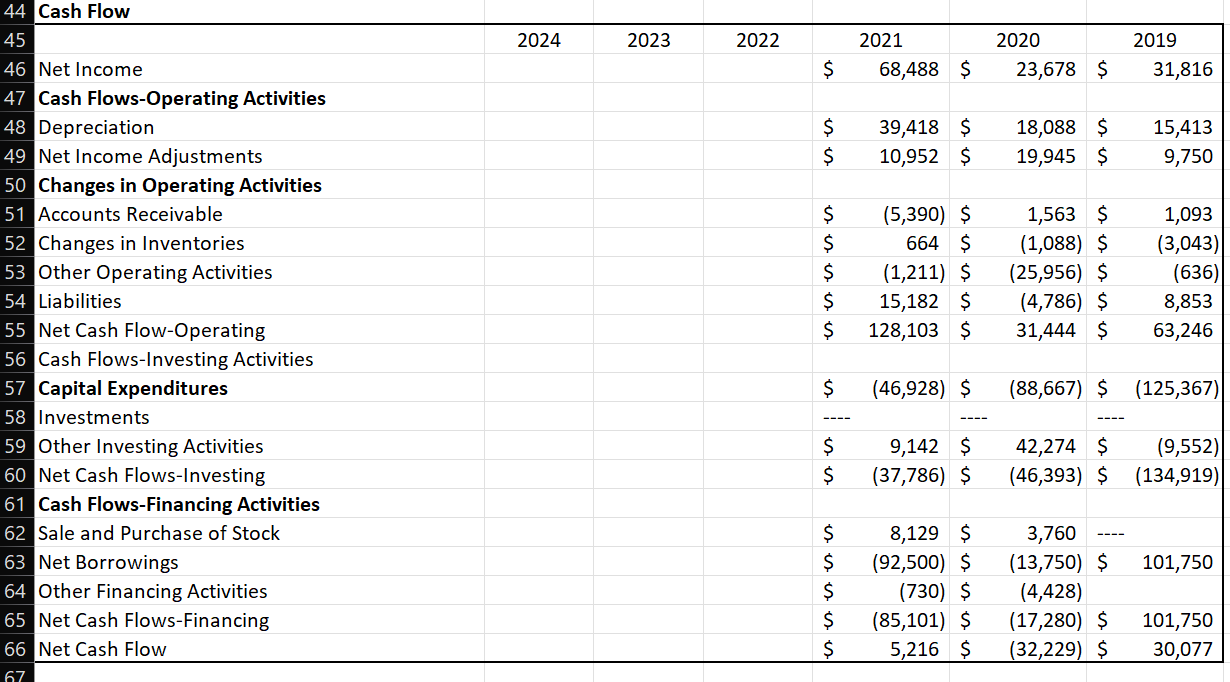
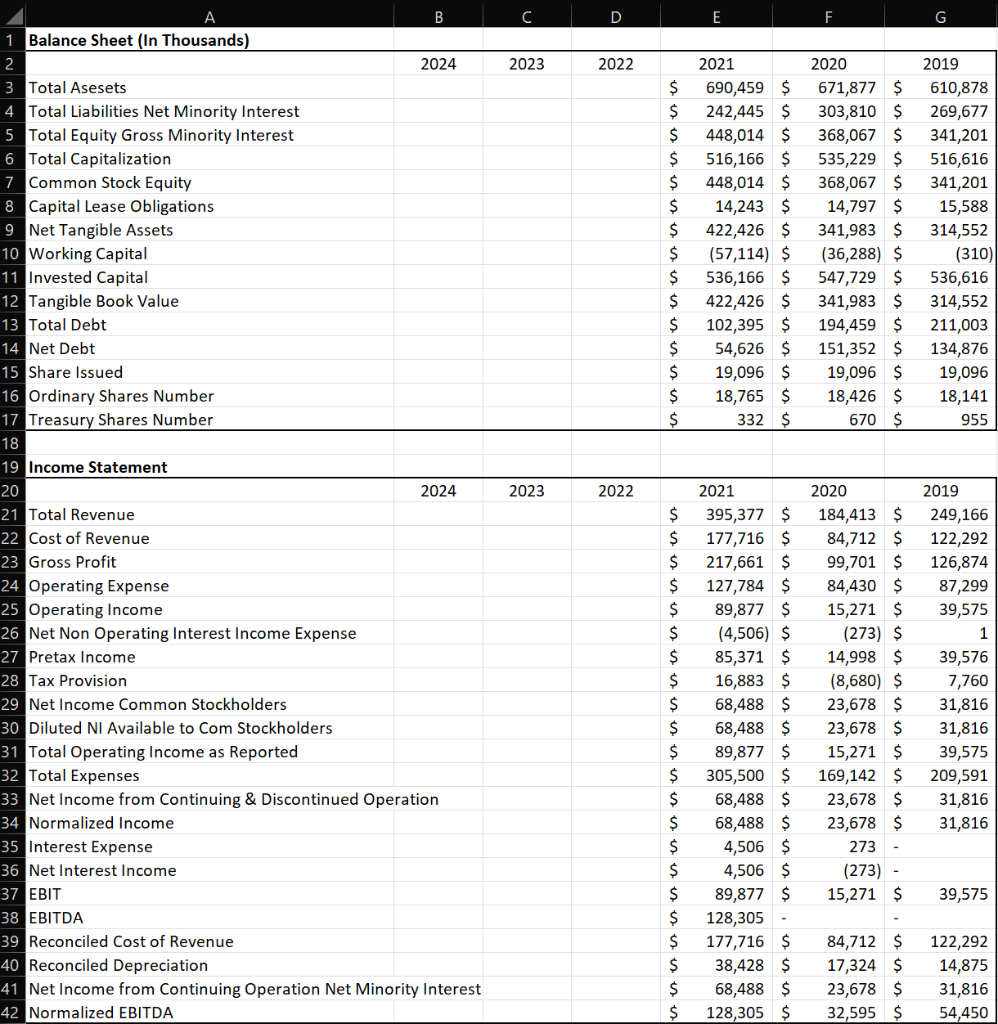
2024 2023 2022 2021 68,488 $ 2020 23,678 $ 2019 31,816 $ $ $ 39,418 $ 10,952 $ 18,088 $ 19,945 $ 15,413 9,750 $ $ $ $ $ 44 Cash Flow 45 46 Net Income 47 Cash Flows-Operating Activities 48 Depreciation 49 Net Income Adjustments 50 Changes in Operating Activities 51 Accounts Receivable 52 Changes in Inventories 53 Other Operating Activities 54 Liabilities 55 Net Cash Flow-Operating 56 Cash Flows-Investing Activities 57 Capital Expenditures 58 Investments 59 Other Investing Activities 60 Net Cash Flows-Investing 61 Cash Flows-Financing Activities 62 Sale and Purchase of Stock 63 Net Borrowings 64 Other Financing Activities 65 Net Cash Flows-Financing 66 Net Cash Flow 67 (5,390) $ 664 $ (1,211) $ 15,182 $ 128,103 $ 1,563 $ (1,088) $ (25,956) $ (4,786) $ 31,444 $ 1,093 (3,043) (636) 8,853 63,246 $ (46,928) $ (88,667) $ (125,367) $ $ 9,142 $ (37,786) $ 42,274 $ (46,393) $ (9,552) (134,919) 101,750 $ $ $ $ $ 8,129 $ (92,500) $ (730) $ (85,101) $ 5,216 $ 3,760 (13,750) $ (4,428) (17,280) $ (32,229) $ 101,750 30,077 C D E G 2023 2022 $ $ $ $ $ $ $ $ $ $ $ $ $ $ $ 2021 690,459 $ 242,445 $ 448,014 $ 516,166 $ 448,014 $ 14,243 $ 422,426 $ (57,114) $ 536,166 $ 422,426 $ 102,395 $ 54,626 $ 19,096 $ 18,765 $ 332 $ 2020 671,877 $ 303,810 $ 368,067 $ 535,229 $ 368,067 $ 14,797 $ 341,983 $ (36,288) $ 547,729 $ 341,983 $ 194,459 $ 151,352 $ 19,096 $ 18,426 $ 670 $ 2019 610,878 269,677 341,201 516,616 341,201 15,588 314,552 (310) 536,616 314,552 211,003 134,876 19,096 18,141 955 2023 2022 B 1 Balance Sheet (In Thousands) 2024 3 Total Asesets 4 Total Liabilities Net Minority Interest 5 Total Equity Gross Minority Interest 6 Total Capitalization 7 Common Stock Equity 8 Capital Lease Obligations 9 Net Tangible Assets 10 Working Capital 11 Invested Capital 12 Tangible Book Value 13 Total Debt 14 Net Debt 15 Share Issued 16 Ordinary Shares Number 17 Treasury Shares Number 18 19 Income Statement 20 2024 21 Total Revenue 22 Cost of Revenue 23 Gross Profit 24 Operating Expense 25 Operating Income 26 Net Non Operating Interest Income Expense 27 Pretax Income 28 Tax Provision 29 Net Income Common Stockholders 30 Diluted NI Available to Com Stockholders 31 Total Operating Income as Reported 32 Total Expenses 33 Net Income from Continuing & Discontinued Operation 34 Normalized Income 35 Interest Expense 36 Net Interest Income 37 EBIT 38 EBITDA 39 Reconciled Cost of Revenue 40 Reconciled Depreciation 41 Net Income from Continuing Operation Net Minority Interest 42 Normalized EBITDA $ $ $ $ $ $ $ $ $ $ $ $ $ $ $ $ $ $ $ $ $ $ 2021 395,377 $ 177,716 $ 217,661 $ 127,784 $ 89,877 $ (4,506) $ 85,371 $ 16,883 $ 68,488 $ 68,488 $ 89,877 $ 305,500 $ 68,488 $ 68,488 $ 4,506 $ 4,506 $ 89,877 $ 128,305 - 177,716 $ 38,428 $ 68,488 $ 128,305 $ 2020 184,413 $ 84,712 $ 99,701 $ 84,430 $ 15,271 $ (273) $ 14,998 $ (8,680) $ 23,678 $ 23,678 $ 15,271 $ 169,142 $ 23,678 $ 23,678 $ 273 (273) - 15,271 $ 2019 249,166 122,292 126,874 87,299 39,575 1 39,576 7,760 31,816 31,816 39,575 209,591 31,816 31,816 39,575 84,712 $ 17,324 $ 23,678 $ 32,595 $ 122,292 14,875 31,816 54,450 2024 2023 2022 2021 68,488 $ 2020 23,678 $ 2019 31,816 $ $ $ 39,418 $ 10,952 $ 18,088 $ 19,945 $ 15,413 9,750 $ $ $ $ $ 44 Cash Flow 45 46 Net Income 47 Cash Flows-Operating Activities 48 Depreciation 49 Net Income Adjustments 50 Changes in Operating Activities 51 Accounts Receivable 52 Changes in Inventories 53 Other Operating Activities 54 Liabilities 55 Net Cash Flow-Operating 56 Cash Flows-Investing Activities 57 Capital Expenditures 58 Investments 59 Other Investing Activities 60 Net Cash Flows-Investing 61 Cash Flows-Financing Activities 62 Sale and Purchase of Stock 63 Net Borrowings 64 Other Financing Activities 65 Net Cash Flows-Financing 66 Net Cash Flow 67 (5,390) $ 664 $ (1,211) $ 15,182 $ 128,103 $ 1,563 $ (1,088) $ (25,956) $ (4,786) $ 31,444 $ 1,093 (3,043) (636) 8,853 63,246 $ (46,928) $ (88,667) $ (125,367) $ $ 9,142 $ (37,786) $ 42,274 $ (46,393) $ (9,552) (134,919) 101,750 $ $ $ $ $ 8,129 $ (92,500) $ (730) $ (85,101) $ 5,216 $ 3,760 (13,750) $ (4,428) (17,280) $ (32,229) $ 101,750 30,077 C D E G 2023 2022 $ $ $ $ $ $ $ $ $ $ $ $ $ $ $ 2021 690,459 $ 242,445 $ 448,014 $ 516,166 $ 448,014 $ 14,243 $ 422,426 $ (57,114) $ 536,166 $ 422,426 $ 102,395 $ 54,626 $ 19,096 $ 18,765 $ 332 $ 2020 671,877 $ 303,810 $ 368,067 $ 535,229 $ 368,067 $ 14,797 $ 341,983 $ (36,288) $ 547,729 $ 341,983 $ 194,459 $ 151,352 $ 19,096 $ 18,426 $ 670 $ 2019 610,878 269,677 341,201 516,616 341,201 15,588 314,552 (310) 536,616 314,552 211,003 134,876 19,096 18,141 955 2023 2022 B 1 Balance Sheet (In Thousands) 2024 3 Total Asesets 4 Total Liabilities Net Minority Interest 5 Total Equity Gross Minority Interest 6 Total Capitalization 7 Common Stock Equity 8 Capital Lease Obligations 9 Net Tangible Assets 10 Working Capital 11 Invested Capital 12 Tangible Book Value 13 Total Debt 14 Net Debt 15 Share Issued 16 Ordinary Shares Number 17 Treasury Shares Number 18 19 Income Statement 20 2024 21 Total Revenue 22 Cost of Revenue 23 Gross Profit 24 Operating Expense 25 Operating Income 26 Net Non Operating Interest Income Expense 27 Pretax Income 28 Tax Provision 29 Net Income Common Stockholders 30 Diluted NI Available to Com Stockholders 31 Total Operating Income as Reported 32 Total Expenses 33 Net Income from Continuing & Discontinued Operation 34 Normalized Income 35 Interest Expense 36 Net Interest Income 37 EBIT 38 EBITDA 39 Reconciled Cost of Revenue 40 Reconciled Depreciation 41 Net Income from Continuing Operation Net Minority Interest 42 Normalized EBITDA $ $ $ $ $ $ $ $ $ $ $ $ $ $ $ $ $ $ $ $ $ $ 2021 395,377 $ 177,716 $ 217,661 $ 127,784 $ 89,877 $ (4,506) $ 85,371 $ 16,883 $ 68,488 $ 68,488 $ 89,877 $ 305,500 $ 68,488 $ 68,488 $ 4,506 $ 4,506 $ 89,877 $ 128,305 - 177,716 $ 38,428 $ 68,488 $ 128,305 $ 2020 184,413 $ 84,712 $ 99,701 $ 84,430 $ 15,271 $ (273) $ 14,998 $ (8,680) $ 23,678 $ 23,678 $ 15,271 $ 169,142 $ 23,678 $ 23,678 $ 273 (273) - 15,271 $ 2019 249,166 122,292 126,874 87,299 39,575 1 39,576 7,760 31,816 31,816 39,575 209,591 31,816 31,816 39,575 84,712 $ 17,324 $ 23,678 $ 32,595 $ 122,292 14,875 31,816 54,450