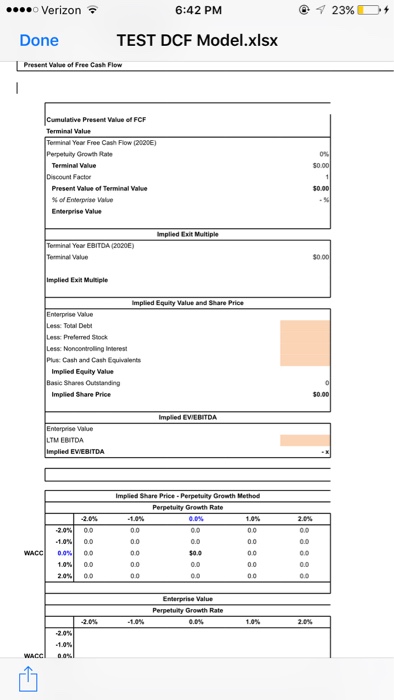
Question
How to do dcf evaluation model without any number in an excel sheet DISCOUNTED CASH FLOW Name Alaska Communications Systems Group Inc. Currency Trading Date
How to do dcf evaluation model without any number in an excel sheet

DISCOUNTED CASH FLOW Name Alaska Communications Systems Group Inc. Currency Trading Date Ticker ALSK Data Adjusted (If available) Current Stock Price Input Calculation (NUMBERS IN THOUSANDS) Mid-Year Convention Historical Period Projection Period CAGR 2012 2013 2014 2015 2016 2017 2018 2019 2020 ('15 - '19) Sales - - - - - - % growth #NAME? #NAME? #NAME? #NAME? #NAME? #NAME? #NAME? #NAME? Cost of Goods Sold #NAME? #NAME? #NAME? #NAME? #NAME? Gross Profit - - - - #NAME? #NAME? #NAME? #NAME? #NAME? - % margin #NAME? #NAME? #NAME? #NAME? #NAME? #NAME? #NAME? #NAME? #NAME? Operating Expenses #NAME? #NAME? #NAME? #NAME? #NAME? EBITDA - - - - #NAME? #NAME? #NAME? #NAME? #NAME? - % margin #NAME? #NAME? #NAME? #NAME? #NAME? #NAME? #NAME? #NAME? #NAME? Depreciation & Amortization #NAME? #NAME? #NAME? #NAME? #NAME? EBIT - - - - #NAME? #NAME? #NAME? #NAME? #NAME? - % margin #NAME? #NAME? #NAME? #NAME? #NAME? #NAME? #NAME? #NAME? #NAME? Taxes #NAME? #NAME? #NAME? #NAME? #NAME? EBIAT - - - - #NAME? #NAME? #NAME? #NAME? #NAME? - Plus: Depreciation & Amortization - - - - #NAME? #NAME? #NAME? #NAME? #NAME? Less: Capital Expenditures #NAME? #NAME? #NAME? #NAME? #NAME? Less: Inc./(Dec.) in Net Working Capital #NAME? #NAME? #NAME? #NAME? #NAME? Assumptions Sales (% growth) NA #NAME? #NAME? #NAME? - % - % - % - % - % COGS (% sales) #NAME? #NAME? #NAME? #NAME? #NAME? #NAME? #NAME? #NAME? #NAME? OPEX (% sales) #NAME? #NAME? #NAME? #NAME? #NAME? #NAME? #NAME? #NAME? #NAME? Depreciation & Amortization (% sales) #NAME? #NAME? #NAME? #NAME? #NAME? #NAME? #NAME? #NAME? #NAME? Capital Expenditures (% sales) #NAME? #NAME? #NAME? #NAME? #NAME? #NAME? #NAME? #NAME? #NAME? Tax Rate (Effective) 25.0% 25.0% 25.0% 25.0% 25.0% Working Capital (% sales) - % - % - % - % - % Unlevered Free Cash Flow #NAME? #NAME? #NAME? #NAME? #NAME? WACC - % Discount Period 1.0 2.0 3.0 4.0 5.0 Discount Factor 1.00 1.00 1.00 1.00 1.00 Present Value of Free Cash Flow #NAME? #NAME? #NAME? #NAME? #NAME? Output Analysis Perpetuity Growth Method - Value per Share EBITDA Multiple Method - Value per Share Cumulative Present Value of FCF #NAME? Cumulative Present Value of FCF #NAME? Terminal Value Terminal Value Terminal Year Free Cash Flow (2020E) #NAME? Terminal Year EBITDA (2020E) #NAME? Perpetuity Growth Rate - % Exit Multiple Terminal Value - Terminal Value #NAME? Discount Factor 1.00 Discount Factor 1.00 Present Value of Terminal Value - Present Value of Terminal Value #NAME? % of Enterprise Value - % % of Enterprise Value - % Enterprise Value #NAME? Enterprise Value #NAME? Implied Exit Multiple Implied Perpetuity Growth Rate Terminal Year EBITDA (2020E) #NAME? Terminal Year Free Cash Flow (2020E) #NAME? Terminal Value - WACC - Terminal Value #NAME? Implied Exit Multiple #NAME? Implied Perpetuity Growth Rate - % Implied Equity Value and Share Price Implied Equity Value and Share Price Enterprise Value #NAME? Enterprise Value #NAME? Less: Total Debt Less: Total Debt - Less: Preferred Stock Less: Preferred Stock - Less: Noncontrolling Interest Less: Noncontrolling Interest - Plus: Cash and Cash Equivalents Plus: Cash and Cash Equivalents - Implied Equity Value #NAME? Implied Equity Value #NAME? Basic Shares Outstanding - Basic Shares Outstanding - Implied Share Price - Implied Share Price - Implied EV/EBITDA Implied EV/EBITDA Enterprise Value #NAME? Enterprise Value #NAME? LTM EBITDA LTM EBITDA - Implied EV/EBITDA - x Implied EV/EBITDA - x Perpetuity Growth Method - Sensitivity Analysis EBITDA Multiple Method - Sensitivity Analysis Implied Share Price - Perpetuity Growth Method Implied Share Price - Exit Multiple Method Perpetuity Growth Rate Exit Multiple 0.0 -2.0% -1.0% 0.0% 1.0% 2.0% 0.0 -2.0x -1.0x 0.0x 1.0x 2.0x WACC -2.0% 0.0 0.0 0.0 0.0 0.0 WACC -2.0% 0.0 0.0 0.0 0.0 0.0 -1.0% 0.0 0.0 0.0 0.0 0.0 -1.0% 0.0 0.0 0.0 0.0 0.0 0.0% 0.0 0.0 $0.0 0.0 0.0 0.0% 0.0 0.0 $0.0 0.0 0.0 1.0% 0.0 0.0 0.0 0.0 0.0 1.0% 0.0 0.0 0.0 0.0 0.0 2.0% 0.0 0.0 0.0 0.0 0.0 2.0% 0.0 0.0 0.0 0.0 0.0 Enterprise Value Enterprise Value Perpetuity Growth Rate Exit Multiple ###### -2.0% -1.0% 0.0% 1.0% 2.0% #NAME? -2.0x -1.0x 0.0x 1.0x 2.0x WACC -2.0% #NAME? #NAME? #NAME? #NAME? #NAME? WACC -2.0% #NAME? #NAME? #NAME? #NAME? #NAME? -1.0% #NAME? #NAME? #NAME? #NAME? #NAME? -1.0% #NAME? #NAME? #NAME? #NAME? #NAME? 0.0% #NAME? #NAME? #NAME? #NAME? #NAME? 0.0% #NAME? #NAME? #NAME? #NAME? #NAME? 1.0% #NAME? #NAME? #NAME? #NAME? #NAME? 1.0% #NAME? #NAME? #NAME? #NAME? #NAME? 2.0% #NAME? #NAME? #NAME? #NAME? #NAME? 2.0% #NAME? #NAME? #NAME? #NAME? #NAME? Implied Exit Multiple Implied Perpetuity Growth Rate Perpetuity Growth Rate Exit Multiple WACC ###### -2.0% -1.0% 0.0% 1.0% 2.0% - % -2.0x -1.0x 0.0x 1.0x 2.0x -2.0% #NAME? #NAME? #NAME? #NAME? #NAME? WACC -2.0% - % - % - % - % - % -1.0% #NAME? #NAME? #NAME? #NAME? #NAME? -1.0% - % - % - % - % - % 0.0% #NAME? #NAME? #NAME? #NAME? #NAME? 0.0% - % - % - % - % - % 1.0% #NAME? #NAME? #NAME? #NAME? #NAME? 1.0% - % - % - % - % - % 2.0% #NAME? #NAME? #NAME? #NAME? #NAME? 2.0% - % - % - % - % - % Calculation of Implied Share Price Enterprise Value #NAME? Less: Total Debt - Less: Preferred Securities - Less: Noncontrolling Interest - Plus: Cash and Cash Equivalents - Implied Equity Value #NAME? Basic Shares Outstanding - Implied Share Price -
6:42 PM o Verizon TEST DCF Model xlsx Done Present Value of Free Cash Flow cumulative Present value of Terminal Value Terminal Year Free Cash Flow 2020E) Perpetuity Growth Rate Discount Factor of Enterprise Value Enterprise Value implied Exit Multiple erminal Year EBITDA p2020E) Terminal Value implied Exit Multiple implied Equity Value and Share Price nterprise Value Less Preferred Stock Less Nonoontroling interest Plus: Cash and Cash Equivalents Implied Equity Value Basic Shares Outstanding Implied Share Price Implied EMEBITDA nterprise Value LTM EBITDA Implied EMEBITDA Implied Share Price -Perpetuity Growth Method Perpetuity Growth Rate 0.0% 00 $0.0 00 00 00 Enterprise Value Perpetuity Growth Rate 23% $000 $0.00Step by Step Solution
There are 3 Steps involved in it
Step: 1

Get Instant Access to Expert-Tailored Solutions
See step-by-step solutions with expert insights and AI powered tools for academic success
Step: 2

Step: 3

Ace Your Homework with AI
Get the answers you need in no time with our AI-driven, step-by-step assistance
Get Started


