Answered step by step
Verified Expert Solution
Question
1 Approved Answer
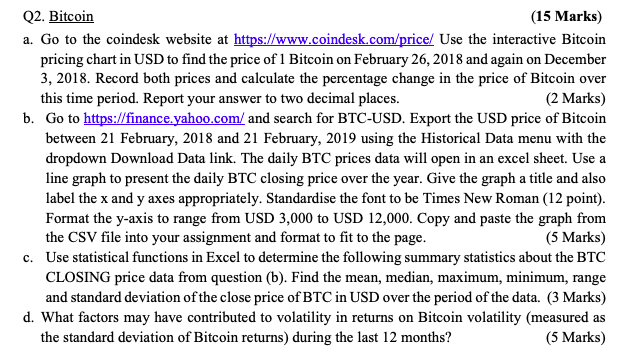
how to explain the part D (15 Marks) a. Go to the coindesk website at https://www.coindesk.com/price! Use the interactive Bitcoin pricing chart in USD to

how to explain the part D
(15 Marks) a. Go to the coindesk website at https://www.coindesk.com/price! Use the interactive Bitcoin pricing chart in USD to find the price of 1 Bitcoin on February 26,2018 and again on December 3, 2018. Record both prices and calculate the percentage change in the price of Bitcoin over (2 Marks) and search for BTC-USD. Export the USD price of Bitcoin February, 2019 using the Historical Data menu with the dropdown Download Data link. The daily BTC prices data will open in an excel sheet. Use a line graph to present the daily BTC closing price over the year. Give the graph a title and also label the x and y axes appropriately. Standardise the font to be Times New Roman (12 point) Format the y-axis to range from USD 3,000 to USD 12,000. Copy and paste the graph from (5 Marks) c. Use statistical functions in Excel to determine the following summary statistics about the BTC CLOSING price data from question (b). Find the mean, median, maximum, minimum, range and standard deviation of the close price of BTC in USD over the period of the data. (3 Marks) d. What factors may have contributed to volatility in returns on Bitcoin volatility (measured as (5 Marks) Q2. Bitcoin this time period. Report your answer to two decimal places b. Go to finand ah between 21 February, 2018 and 21 the CSV file into your assignment and format to fit to the page the standard deviation of Bitcoin returns) during the last 12 monthsStep by Step Solution
There are 3 Steps involved in it
Step: 1

Get Instant Access to Expert-Tailored Solutions
See step-by-step solutions with expert insights and AI powered tools for academic success
Step: 2

Step: 3

Ace Your Homework with AI
Get the answers you need in no time with our AI-driven, step-by-step assistance
Get Started


