

Answered step by step
Verified Expert Solution
Question
1 Approved Answer
Calculate NPV in cell D72 calculate IRR in cell D73 Calculate MIRR in cell D74 Can someone pls help me with the values I should
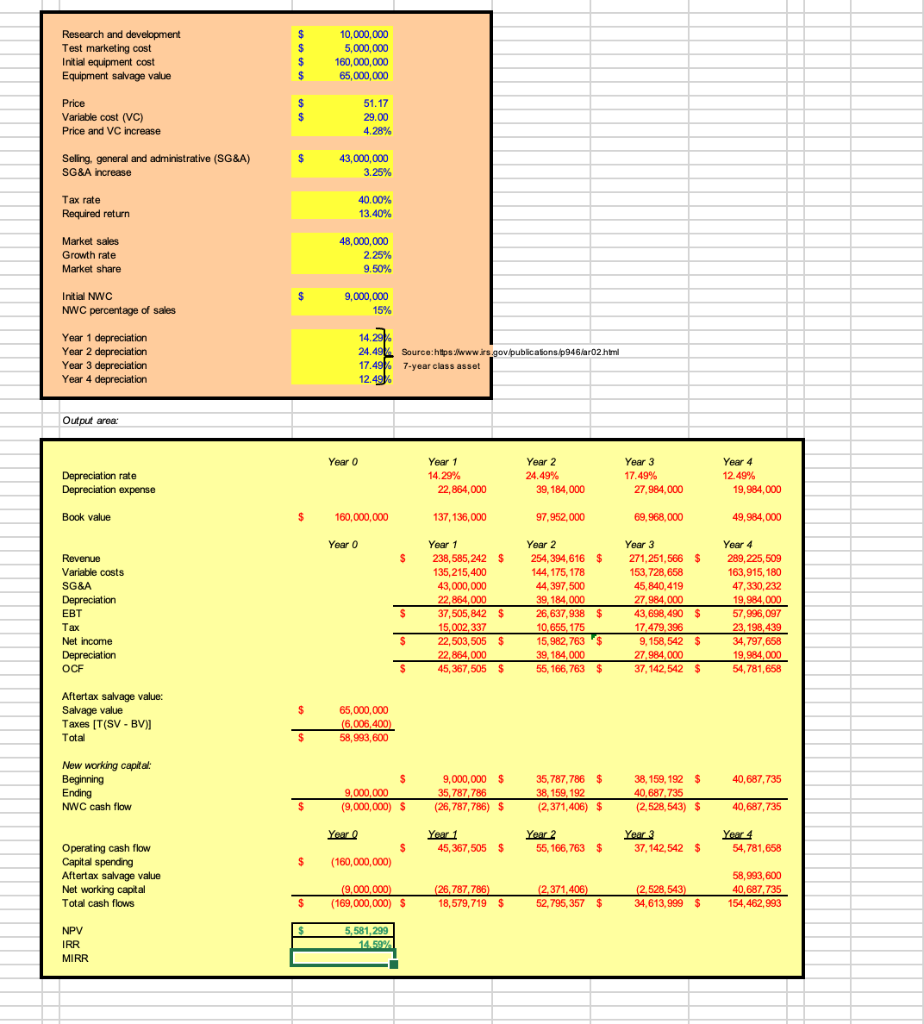
Calculate NPV in cell D72
calculate IRR in cell D73
Calculate MIRR in cell D74
Can someone pls help me with the values I should input into these formulas?
Research and development Test marketing cost Initial equipment cost Equipment salvage value $ $ $ $ 10,000,000 5,000,000 160,000,000 65,000,000 $ $ 51.17 29.00 4.28% Price Variable cost (VC) Price and VC increase Seling, general and administrative (SG&A) SG&A increase $ 43,000,000 3.25% Tax rate Required return 40.00% 13.40% Market sales Growth rate Market share 48,000,000 2.25% 9.50% $ Initial NWC NWC percentage of sales 9,000,000 15% Year 1 depreciation Year 2 depreciation Year 3 depreciation Year 4 depreciation 14.29% 24.494 Source:hts/www.rs.gov/publications/p946/ar02.html 17.49% 7-year class asset 12.49 Output area: Year o Depreciation rate Depreciation expense Year 1 14.29% 22,864,000 Year 2 24.49% 39,184,000 Year 3 17.49% 27,984,000 Year 4 12.49% 19,984,000 Book value $ 160,000,000 137, 136,000 97,952,000 69,968,000 49,984,000 Year o $ Revenue Variable costs SG&A Depreciation EBT Tax Net Income Depreciation OCF Year 1 238,585,242 $ 135,215,400 43,000,000 22,884,000 37,505,842 $ 15,002,337 22,503,505 $ 22,864,000 45,367,505 $ Year 2 254,394, 616 $ 144, 175, 178 44 397,500 39. 184,000 26,637,938 $ 10,655, 175 15,982.763 $ 39,184.000 55, 166,763 $ Year 3 271,251,566 $ 153.728,658 45,840,419 27,984,000 43,698,490 $ 17,479, 396 9,158,542 $ 27,984,000 37, 142,542 $ Year 4 289,225,509 163,915, 180 47,330,232 19,984,000 57,996,097 23,198,439 34.797,658 19.984,000 54,781,658 $ $ $ $ Aftertax salvage value: Salvage value Taxes [T(SV - BV)] Total 65,000,000 (6,006 400) 58,993,600 $ 40.687,735 New working capital Beginning Ending NWC cash flow $ 9,000,000 (9,000,000) $ $ 9,000,000 $ 35,787 786 (26,787,786) $ 35,787,786 $ 38, 159, 192 (2,371,406) $ 38, 159, 192 $ 40.687735 (2,528,543) $ $ 40,687,735 Year o Year 1 45,367,505 $ Year 2 55, 166,763 $ Year 3 37, 142,542 $ Year 4 54,781,658 $ $ (160,000,000) Operating cash flow Capital spending Aftertax salvage value Net working capital Total cash flows (9,000,000) (169,000,000) $ (26,787,786) 18,579,719 $ (2.371,406) 52,795, 357 $ (2.528,543) 34,613,999 $ $ 58,993,600 40,687,735 154,462,993 $ NPV IRR MIRR 5,581,299 14.59 Research and development Test marketing cost Initial equipment cost Equipment salvage value $ $ $ $ 10,000,000 5,000,000 160,000,000 65,000,000 $ $ 51.17 29.00 4.28% Price Variable cost (VC) Price and VC increase Seling, general and administrative (SG&A) SG&A increase $ 43,000,000 3.25% Tax rate Required return 40.00% 13.40% Market sales Growth rate Market share 48,000,000 2.25% 9.50% $ Initial NWC NWC percentage of sales 9,000,000 15% Year 1 depreciation Year 2 depreciation Year 3 depreciation Year 4 depreciation 14.29% 24.494 Source:hts/www.rs.gov/publications/p946/ar02.html 17.49% 7-year class asset 12.49 Output area: Year o Depreciation rate Depreciation expense Year 1 14.29% 22,864,000 Year 2 24.49% 39,184,000 Year 3 17.49% 27,984,000 Year 4 12.49% 19,984,000 Book value $ 160,000,000 137, 136,000 97,952,000 69,968,000 49,984,000 Year o $ Revenue Variable costs SG&A Depreciation EBT Tax Net Income Depreciation OCF Year 1 238,585,242 $ 135,215,400 43,000,000 22,884,000 37,505,842 $ 15,002,337 22,503,505 $ 22,864,000 45,367,505 $ Year 2 254,394, 616 $ 144, 175, 178 44 397,500 39. 184,000 26,637,938 $ 10,655, 175 15,982.763 $ 39,184.000 55, 166,763 $ Year 3 271,251,566 $ 153.728,658 45,840,419 27,984,000 43,698,490 $ 17,479, 396 9,158,542 $ 27,984,000 37, 142,542 $ Year 4 289,225,509 163,915, 180 47,330,232 19,984,000 57,996,097 23,198,439 34.797,658 19.984,000 54,781,658 $ $ $ $ Aftertax salvage value: Salvage value Taxes [T(SV - BV)] Total 65,000,000 (6,006 400) 58,993,600 $ 40.687,735 New working capital Beginning Ending NWC cash flow $ 9,000,000 (9,000,000) $ $ 9,000,000 $ 35,787 786 (26,787,786) $ 35,787,786 $ 38, 159, 192 (2,371,406) $ 38, 159, 192 $ 40.687735 (2,528,543) $ $ 40,687,735 Year o Year 1 45,367,505 $ Year 2 55, 166,763 $ Year 3 37, 142,542 $ Year 4 54,781,658 $ $ (160,000,000) Operating cash flow Capital spending Aftertax salvage value Net working capital Total cash flows (9,000,000) (169,000,000) $ (26,787,786) 18,579,719 $ (2.371,406) 52,795, 357 $ (2.528,543) 34,613,999 $ $ 58,993,600 40,687,735 154,462,993 $ NPV IRR MIRR 5,581,299 14.59Step by Step Solution
There are 3 Steps involved in it
Step: 1

Get Instant Access to Expert-Tailored Solutions
See step-by-step solutions with expert insights and AI powered tools for academic success
Step: 2

Step: 3
Ace Your Homework with AI
Get the answers you need in no time with our AI-driven, step-by-step assistance
Get Started
Horizons Of Tomorrow Next 50 Years
Authors: Suleyman Ismail
1st Edition
979-8223501329