Answered step by step
Verified Expert Solution
Question
1 Approved Answer
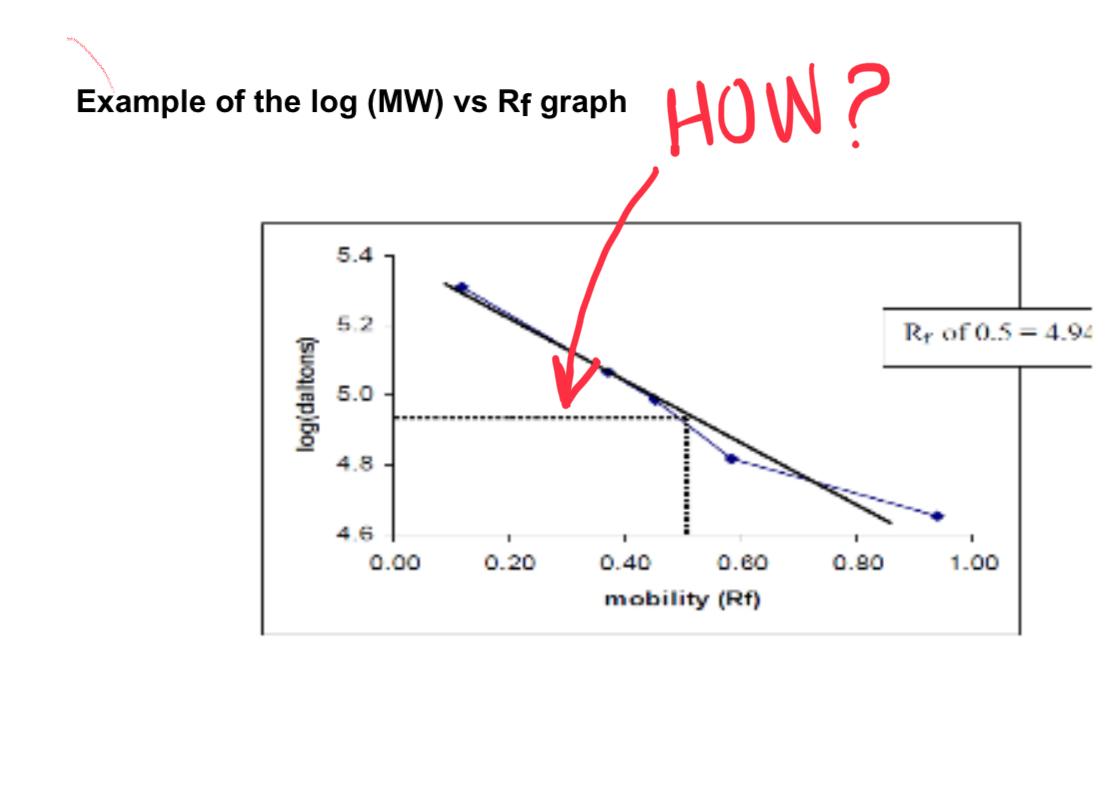
How to find the y-value and how to generate those line use Excel software? I already watch the YT but still didnt find understand how
How to find the y-value and how to generate those line use Excel software? I already watch the YT but still didnt find understand how to do so, most of them just show the dot or calculate the intercept values only.. But not the plotted graph (the 90 angle plotted, like how the dashed line shows in this image). Anyone knows how the step to generate that line? Please show the steps with picture too, if could.
Step by Step Solution
There are 3 Steps involved in it
Step: 1

Get Instant Access to Expert-Tailored Solutions
See step-by-step solutions with expert insights and AI powered tools for academic success
Step: 2

Step: 3

Ace Your Homework with AI
Get the answers you need in no time with our AI-driven, step-by-step assistance
Get Started


