

Question
How to forcecast Gross Room Rates , Direct Rates , GDS Rates , OTA/On-Line Rates , Wholesale Rates ? ( Area occupancies were lower this
How to forcecast Gross Room Rates , Direct Rates , GDS Rates , OTA/On-Line Rates , Wholesale Rates ? ( Area occupancies were lower this year than the previous year. However, the market segment mix and weekday-to-weekend ratios remained similar to previous years )
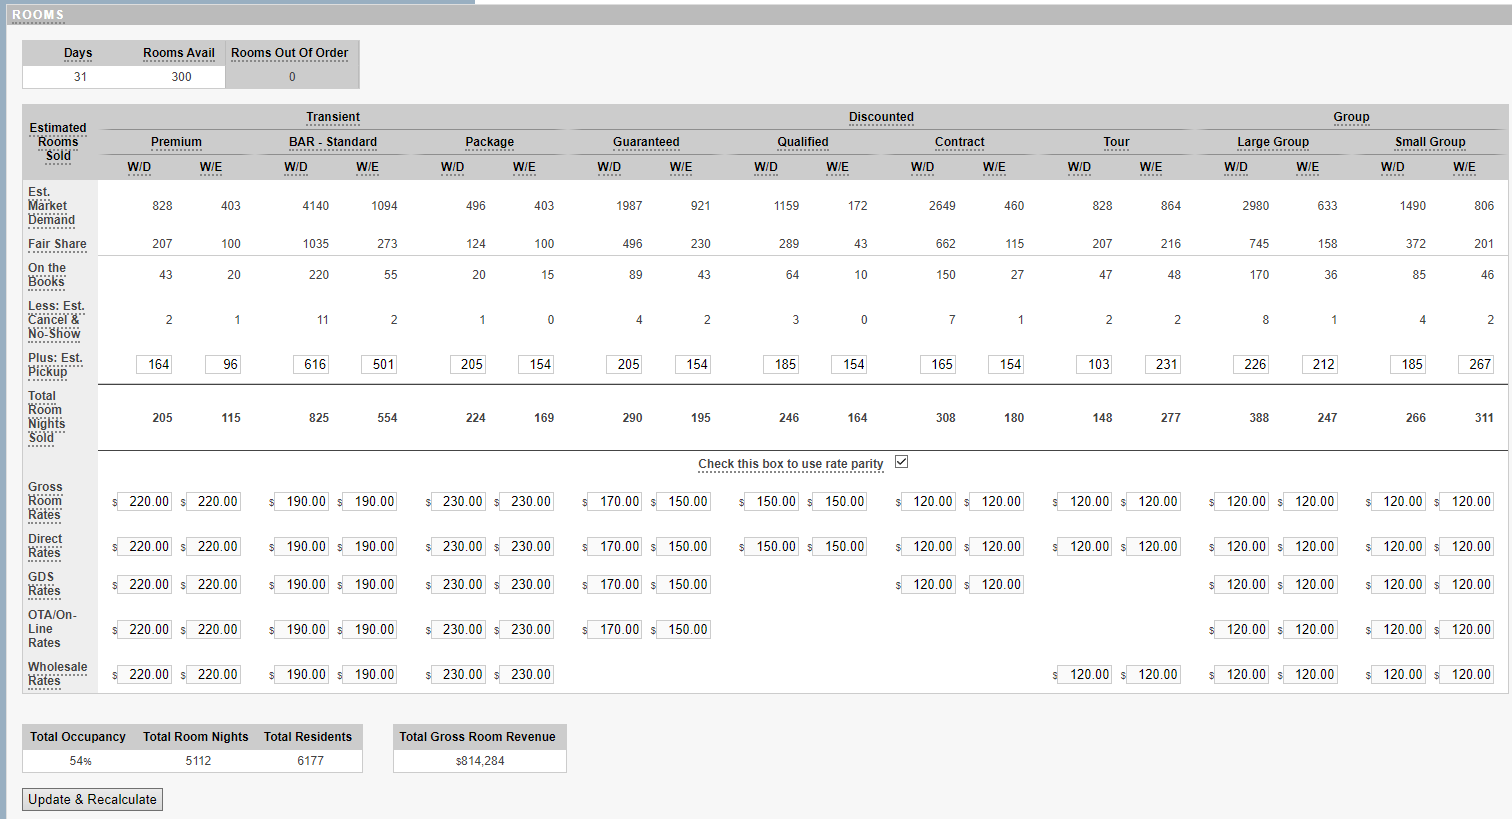
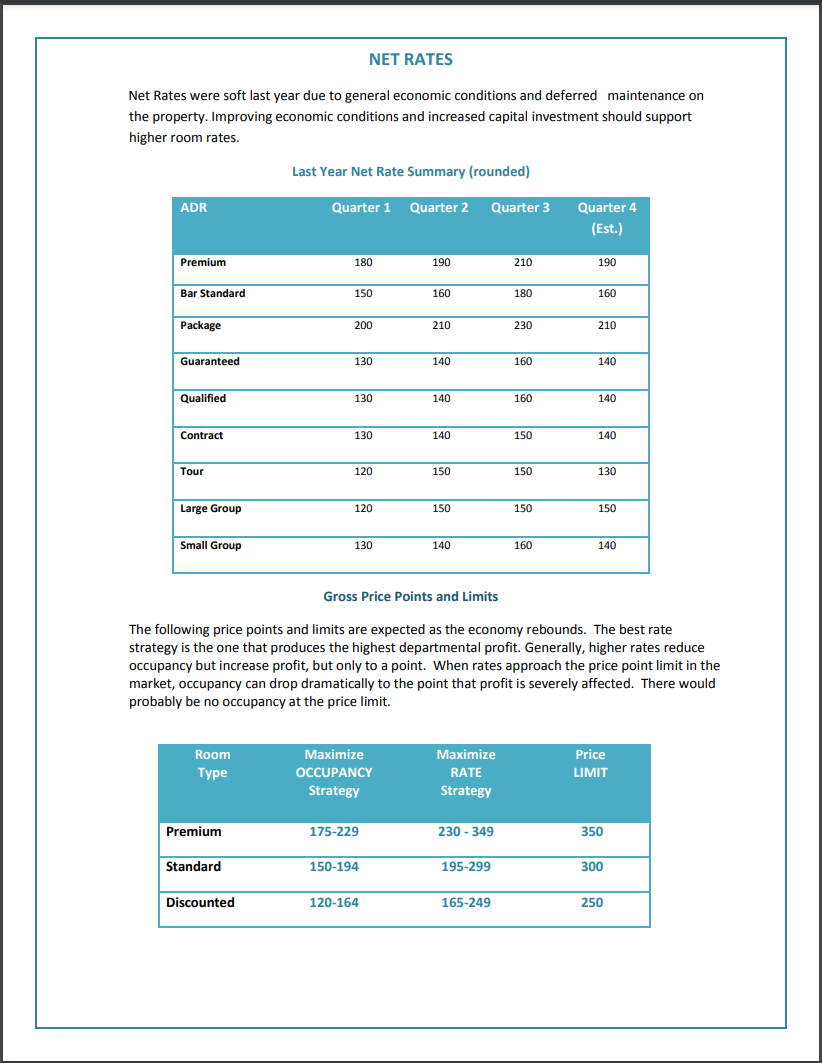
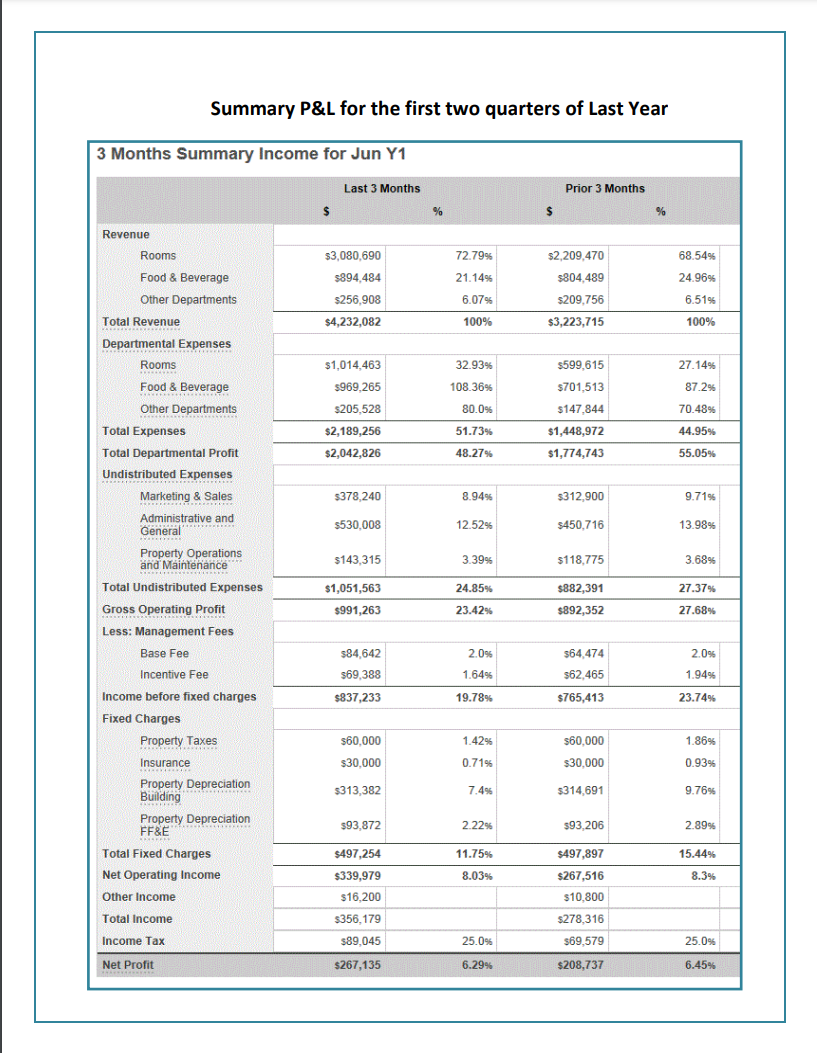
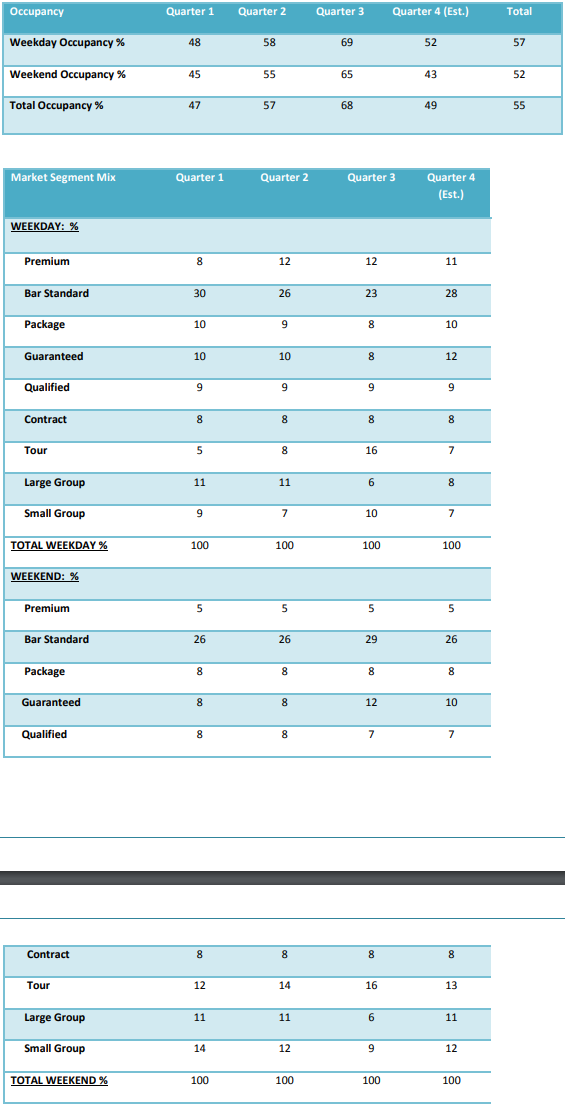 ROOMS \begin{tabular}{|ccc|} \hline Total Occupancy & Total Room Nights & Total Residents \\ \hline 54% & 5112 & 6177 \\ \hline \end{tabular} Total Gross Room Revenue Update \& Recalculate Net Rates were soft last year due to general economic conditions and deferred maintenance on the property. Improving economic conditions and increased capital investment should support higher room rates. Last Year Net Rate Summary (rounded) Gross Price Points and Limits The following price points and limits are expected as the economy rebounds. The best rate strategy is the one that produces the highest departmental profit. Generally, higher rates reduce occupancy but increase profit, but only to a point. When rates approach the price point limit in the market, occupancy can drop dramatically to the point that profit is severely affected. There would probably be no occupancy at the price limit. Summary P\&L for the first two quarters of Last Year \begin{tabular}{|lccccc|} \hline Occupancy & Quarter 1 & Quarter 2 & Quarter 3 & Quarter 4 (Est.) & Total \\ \hline Weekday Occupancy \% & 48 & 58 & 69 & 52 & 57 \\ \hline Weekend Occupancy \% & 45 & 55 & 65 & 43 & 52 \\ \hline Total Occupancy \% & 47 & 57 & 68 & 49 & 55 \\ \hline \end{tabular} WEEKDAY: \% WEEKEND: \% \begin{tabular}{|lcccc} \hline Premium & 5 & 5 & 5 & 5 \\ \hline Bar Standard & 26 & 26 & 29 & 26 \\ \hline Package & 8 & 8 & 8 & 8 \\ \hline Guaranteed & 8 & 8 & 12 & 10 \\ \hline Qualified & 8 & 8 & 7 & 7 \\ \hline \end{tabular} \begin{tabular}{|lcccc} \hline Contract & 8 & 8 & 8 & 8 \\ \hline Tour & 12 & 14 & 16 & 13 \\ \hline Large Group & 11 & 11 & 6 & 11 \\ \hline Small Group & 14 & 12 & 9 & 12 \\ \hline TOTAL WEEKEND \% & 100 & 100 & 100 & 100 \\ \hline \end{tabular} ROOMS \begin{tabular}{|ccc|} \hline Total Occupancy & Total Room Nights & Total Residents \\ \hline 54% & 5112 & 6177 \\ \hline \end{tabular} Total Gross Room Revenue Update \& Recalculate Net Rates were soft last year due to general economic conditions and deferred maintenance on the property. Improving economic conditions and increased capital investment should support higher room rates. Last Year Net Rate Summary (rounded) Gross Price Points and Limits The following price points and limits are expected as the economy rebounds. The best rate strategy is the one that produces the highest departmental profit. Generally, higher rates reduce occupancy but increase profit, but only to a point. When rates approach the price point limit in the market, occupancy can drop dramatically to the point that profit is severely affected. There would probably be no occupancy at the price limit. Summary P\&L for the first two quarters of Last Year \begin{tabular}{|lccccc|} \hline Occupancy & Quarter 1 & Quarter 2 & Quarter 3 & Quarter 4 (Est.) & Total \\ \hline Weekday Occupancy \% & 48 & 58 & 69 & 52 & 57 \\ \hline Weekend Occupancy \% & 45 & 55 & 65 & 43 & 52 \\ \hline Total Occupancy \% & 47 & 57 & 68 & 49 & 55 \\ \hline \end{tabular} WEEKDAY: \% WEEKEND: \% \begin{tabular}{|lcccc} \hline Premium & 5 & 5 & 5 & 5 \\ \hline Bar Standard & 26 & 26 & 29 & 26 \\ \hline Package & 8 & 8 & 8 & 8 \\ \hline Guaranteed & 8 & 8 & 12 & 10 \\ \hline Qualified & 8 & 8 & 7 & 7 \\ \hline \end{tabular} \begin{tabular}{|lcccc} \hline Contract & 8 & 8 & 8 & 8 \\ \hline Tour & 12 & 14 & 16 & 13 \\ \hline Large Group & 11 & 11 & 6 & 11 \\ \hline Small Group & 14 & 12 & 9 & 12 \\ \hline TOTAL WEEKEND \% & 100 & 100 & 100 & 100 \\ \hline \end{tabular}
 Step by Step Solution
There are 3 Steps involved in it
Step: 1

Get Instant Access to Expert-Tailored Solutions
See step-by-step solutions with expert insights and AI powered tools for academic success
Step: 2

Step: 3
Ace Your Homework with AI
Get the answers you need in no time with our AI-driven, step-by-step assistance
Get Started
Options Trading 12 Books In 1 Elevate Your Profits Erase Risks The Definitive Guide From Rookie To Top 1 Trader
Authors: Warren Ray Benjamin
1st Edition
979-8860106413