how to go about the calculations
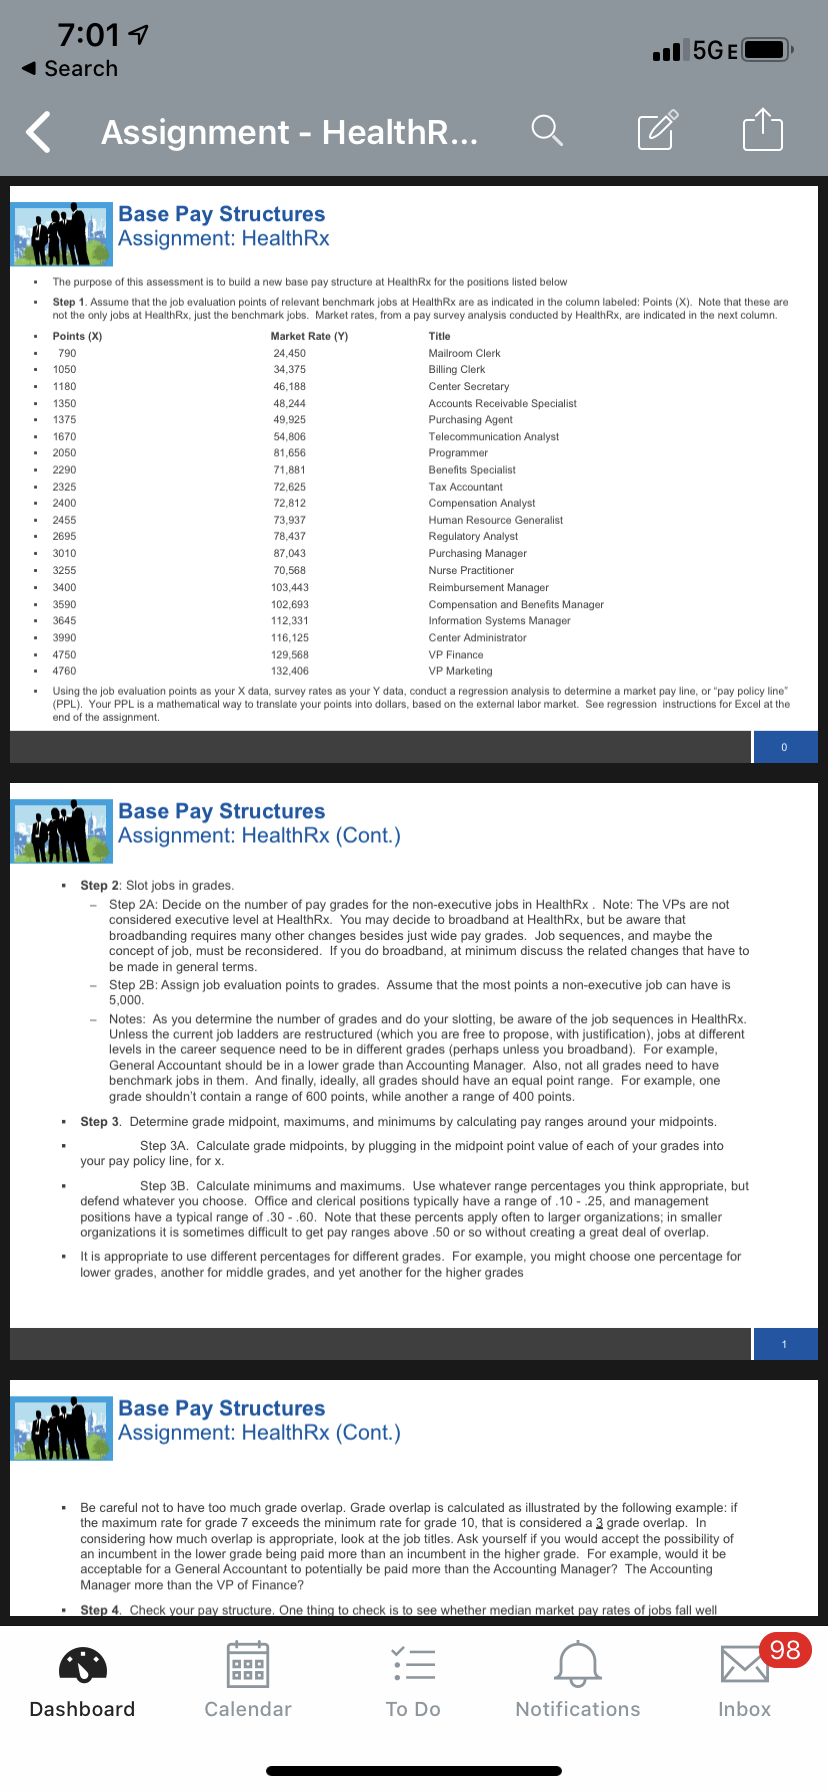
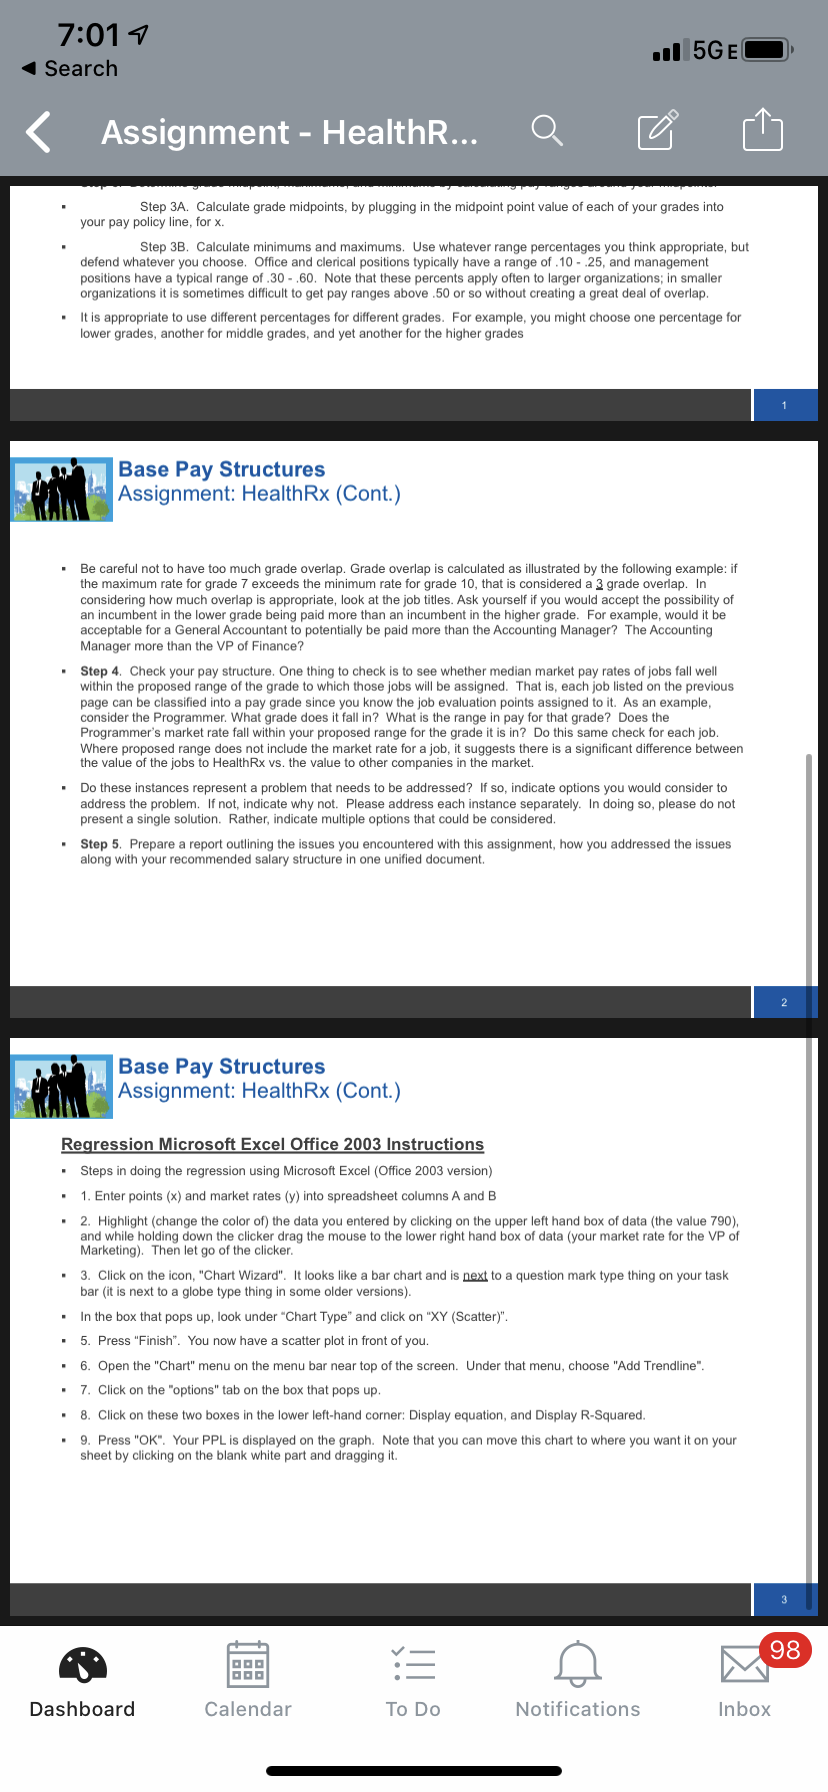
7:017 Search 1 5G EC Assignment - HealthR... Base Pay Structures Assignment: HealthRx The purpose of this assessment is to build a new base pay structure at HealthRx for the positions listed below Step 1. Assume that the job evaluation points of relevant benchmark jobs at HealthRx are as indicated in the column labeled: Points (X). Note that these are not the only jobs at HealthRx, just the benchmark jobs. Market rates, from a pay survey analysis conducted by HealthRx, are indicated in the next column. Points (X) Market Rate (Y) Title 790 24,450 Mailroom Clerk 1050 34,375 Billing Clerk 1180 46,188 Center Secretary 1350 48,244 Accounts Receivable Specialist 1375 49,925 Purchasing Agent 1670 54,806 Telecommunication Analyst 2050 81,656 Programmer 2290 71,88 Benefits Specialist 2325 72.625 Tax Accountant 2400 72.812 Compensation Analyst 2455 73,937 Human Resource Generalist 2695 78,437 Regulatory Analyst 3010 87,043 Purchasing Manager 3255 70.568 Nurse Practitioner 3400 103,443 Reimbursement Manager 3590 102,693 Compensation and Benefits Manager 3645 112,331 Information Systems Manager 3990 116,125 Center Administrator $750 129.568 VP Finance $760 132,406 VP Marketing Using the job evaluation points as your X data, survey rates as your Y data, conduct a regression analysis to determine a market pay line, or "pay policy line" (PPL). Your PPL is a mathematical way to translate your points into dollars, based on the external labor market. See regression instructions for Excel at the end of the assignment. Base Pay Structures Assignment: HealthRx (Cont.) Step 2: Slot jobs in grades. Step 2A: Decide on the number of pay grades for the non-executive jobs in HealthRx . Note: The VPs are not considered executive level at HealthRx. You may decide to broadband at HealthRx, but be aware that broadbanding requires many other changes besides just wide pay grades. Job sequences, and maybe the concept of job, must be reconsidered. If you do broadband, at minimum discuss the related changes that have to be made in general terms. Step 2B: Assign job evaluation points to grades. Assume that the most points a non-executive job can have is 5,000. Notes: As you determine the number of grades and do your slotting, be aware of the job sequences in HealthRx. Unless the current job ladders are restructured (which you are free to propose, with justification), jobs at different levels in the career sequence need to be in different grades (perhaps unless you broadband). For example, General Accountant should be in a lower grade than Accounting Manager. Also, not all grades need to have benchmark jobs in them. And finally, ideally, all grades should have an equal point range. For example, one grade shouldn't contain a range of 600 points, while another a range of 400 points. Step 3. Determine grade midpoint, maximums, and minimums by calculating pay ranges around your midpoints. your pay policy line, for x. Step 3A. Calculate grade midpoints, by plugging in the midpoint point value of each of your grades into Step 3B. Calculate minimums and maximums. Use whatever range percentages you think appropriate, but defend whatever you choose. Office and clerical positions typically have a range of . 10 - .25, and management positions have a typical range of .30 - .60. Note that these percents apply often to larger organizations; in smaller organizations it is sometimes difficult to get pay ranges above .50 or so without creating a great deal of overlap. It is appropriate to use different percentages for different grades. For example, you might choose one percentage for lower grades, another for middle grades, and yet another for the higher grades Base Pay Structures Assignment: HealthRx (Cont.) Be careful not to have too much grade overlap. Grade overlap is calculated as illustrated by the following example: if the maximum rate for grade 7 exceeds the minimum rate for grade 10, that is considered a 3 grade overlap. In considering how much overlap is appropriate, look at the job titles. Ask yourself if you would accept the possibility of an incumbent in the lower grade being paid more than an incumbent in the higher grade. For example, would it be acceptable for a General Accountant to potentially be paid more than the Accounting Manager? The Accounting Manager more than the VP of Finance? Step 4. Check your pay structure. One thing to check is to see whether median market pay rates of jobs fall well 98 Dashboard Calendar To Do Notifications Inbox7:017 Search 1 5G EC Assignment - HealthR... Step 3A. Calculate grade midpoints, by plugging in the midpoint point value of each of your grades into your pay policy line, for x. Step 3B. Calculate minimums and maximums. Use whatever range percentages you think appropriate, but defend whatever you choose. Office and clerical positions typically have a range of . 10 - .25, and management positions have a typical range of .30 - .60. Note that these percents apply often to larger organizations; in smaller organizations it is sometimes difficult to get pay ranges above .50 or so without creating a great deal of overlap. It is appropriate to use different percentages for different grades. For example, you might choose one percentage for lower grades, another for middle grades, and yet another for the higher grades Base Pay Structures Assignment: HealthRx (Cont.) Be careful not to have too much grade overlap. Grade overlap is calculated as illustrated by the following example: if the maximum rate for grade 7 exceeds the minimum rate for grade 10, that is considered a 3 grade overlap. In considering how much overlap is appropriate, look at the job titles. Ask yourself if you would accept the possibility of an incumbent in the lower grade being paid more than an incumbent in the higher grade. For example, would it be acceptable for a General Accountant to potentially be paid more than the Accounting Manager? The Accounting Manager more than the VP of Finance? Step 4. Check your pay structure. One thing to check is to see whether median market pay rates of jobs fall well within the proposed range of the grade to which those jobs will be assigned. That is, each job listed on the previous page can be classified into a pay grade since you know the job evaluation points assigned to it. As an example, consider the Programmer. What grade does it fall in? What is the range in pay for that grade? Does the Programmer's market rate fall within your proposed range for the grade it is in? Do this same check for each job. Where proposed range does not include the market rate for a job, it suggests there is a significant difference between the value of the jobs to HealthRx vs. the value to other companies in the market. Do these instances represent a problem that needs to be addressed? If so, indicate options you would consider to address the problem. If not, indicate why not. Please address each instance separately. In doing so, please do not present a single solution. Rather, indicate multiple options that could be considered. Step 5. Prepare a report outlining the issues you encountered with this assignment, how you addressed the issues along with your recommended salary structure in one unified document. 2 Base Pay Structures Assignment: HealthRx (Cont.) Regression Microsoft Excel Office 2003 Instructions Steps in doing the regression using Microsoft Excel (Office 2003 version) 1. Enter points (x) and market rates (y) into spreadsheet columns A and B 2. Highlight (change the color of) the data you entered by clicking on the upper left hand box of data (the value 790), and while holding down the clicker drag the mouse to the lower right hand box of data (your market rate for the VP of Marketing). Then let go of the clicker. 3. Click on the icon, "Chart Wizard". It looks like a bar chart and is next to a question mark type thing on your task bar (it is next to a globe type thing in some older versions). In the box that pops up, look under "Chart Type" and click on "XY (Scatter)". 5. Press "Finish". You now have a scatter plot in front of you. 6. Open the "Chart" menu on the menu bar near top of the screen. Under that menu, choose "Add Trendline". 7. Click on the "options" tab on the box that pops up. 8. Click on these two boxes in the lower left-hand corner: Display equation, and Display R-Squared. 9. Press "OK". Your PPL is displayed on the graph. Note that you can move this chart to where you want it on your sheet by clicking on the blank white part and dragging it. 3 98 Dashboard Calendar To Do Notifications Inbox