Question
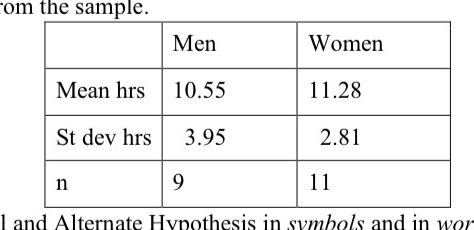
How to solve these problems? Chart is included below.A sociologist believes that for people under the age of 35, women sleep longer per night on
How to solve these problems? Chart is included below.A sociologist believes that for people under the age of 35, women sleep longer per night on the weekend than men. 20 people were surveyed. Test at alpha =5%. The following summary statistics were determined from the sample. a) State the Null and Alternate Hypothesis in symbols and in words. b) Calculate the expected results for the hypothesis test sampling distribution, assuming the NullHypothesis is true. (i.e., name and graph of the sampling distribution, mean and standard error,ASSUME POOLED STANDARD DEVIATIONS) c) Identify the standard distribution that best approximates the sampling distribution. d) Formulate the decision rule(you can use either critical test scores or p-values) e) Determine the statistical sample results, i.e., the differences between the sample means, the pooled standarddeviations, the standard error, the test statistic, degrees of freedom and p-value. f) Determine the conclusion in terms of the Null and Alternate Hypotheses. Do the sample results indicate thatthe sociologist's claim is supported at alpha= 5%?

Step by Step Solution
There are 3 Steps involved in it
Step: 1

Get Instant Access to Expert-Tailored Solutions
See step-by-step solutions with expert insights and AI powered tools for academic success
Step: 2

Step: 3

Ace Your Homework with AI
Get the answers you need in no time with our AI-driven, step-by-step assistance
Get Started


