Answered step by step
Verified Expert Solution
Link Copied!

Question

1 Approved Answer

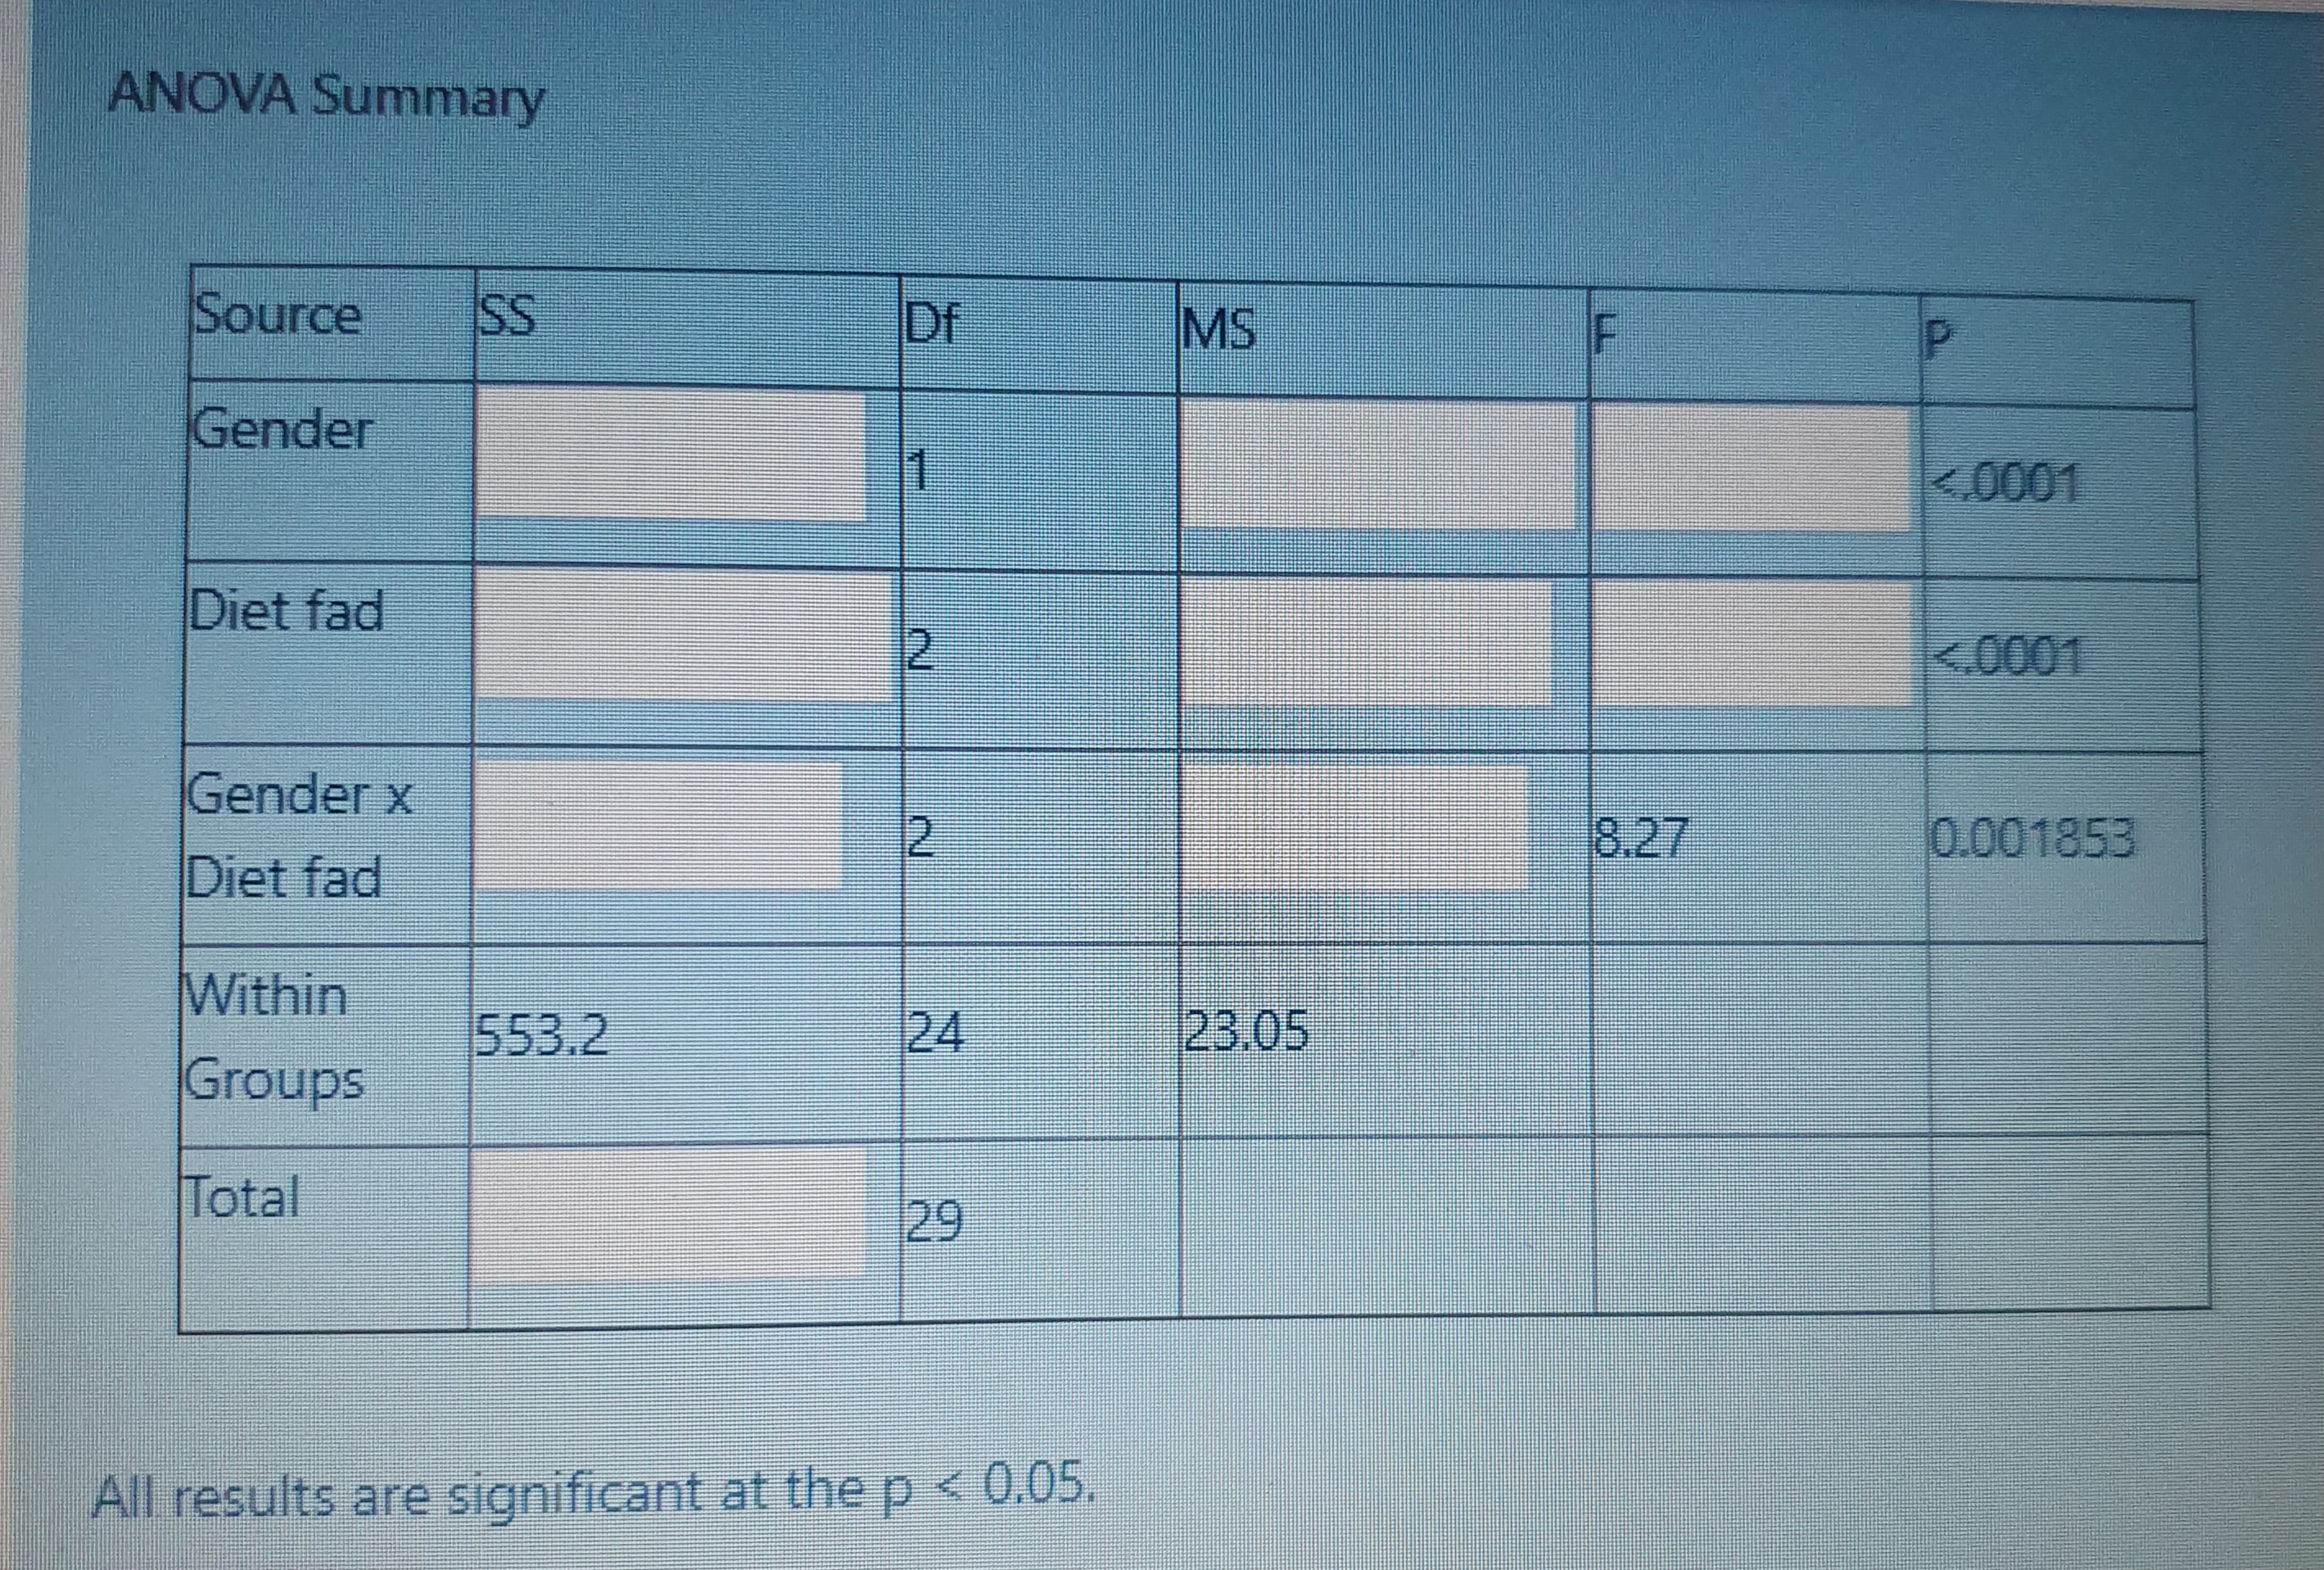
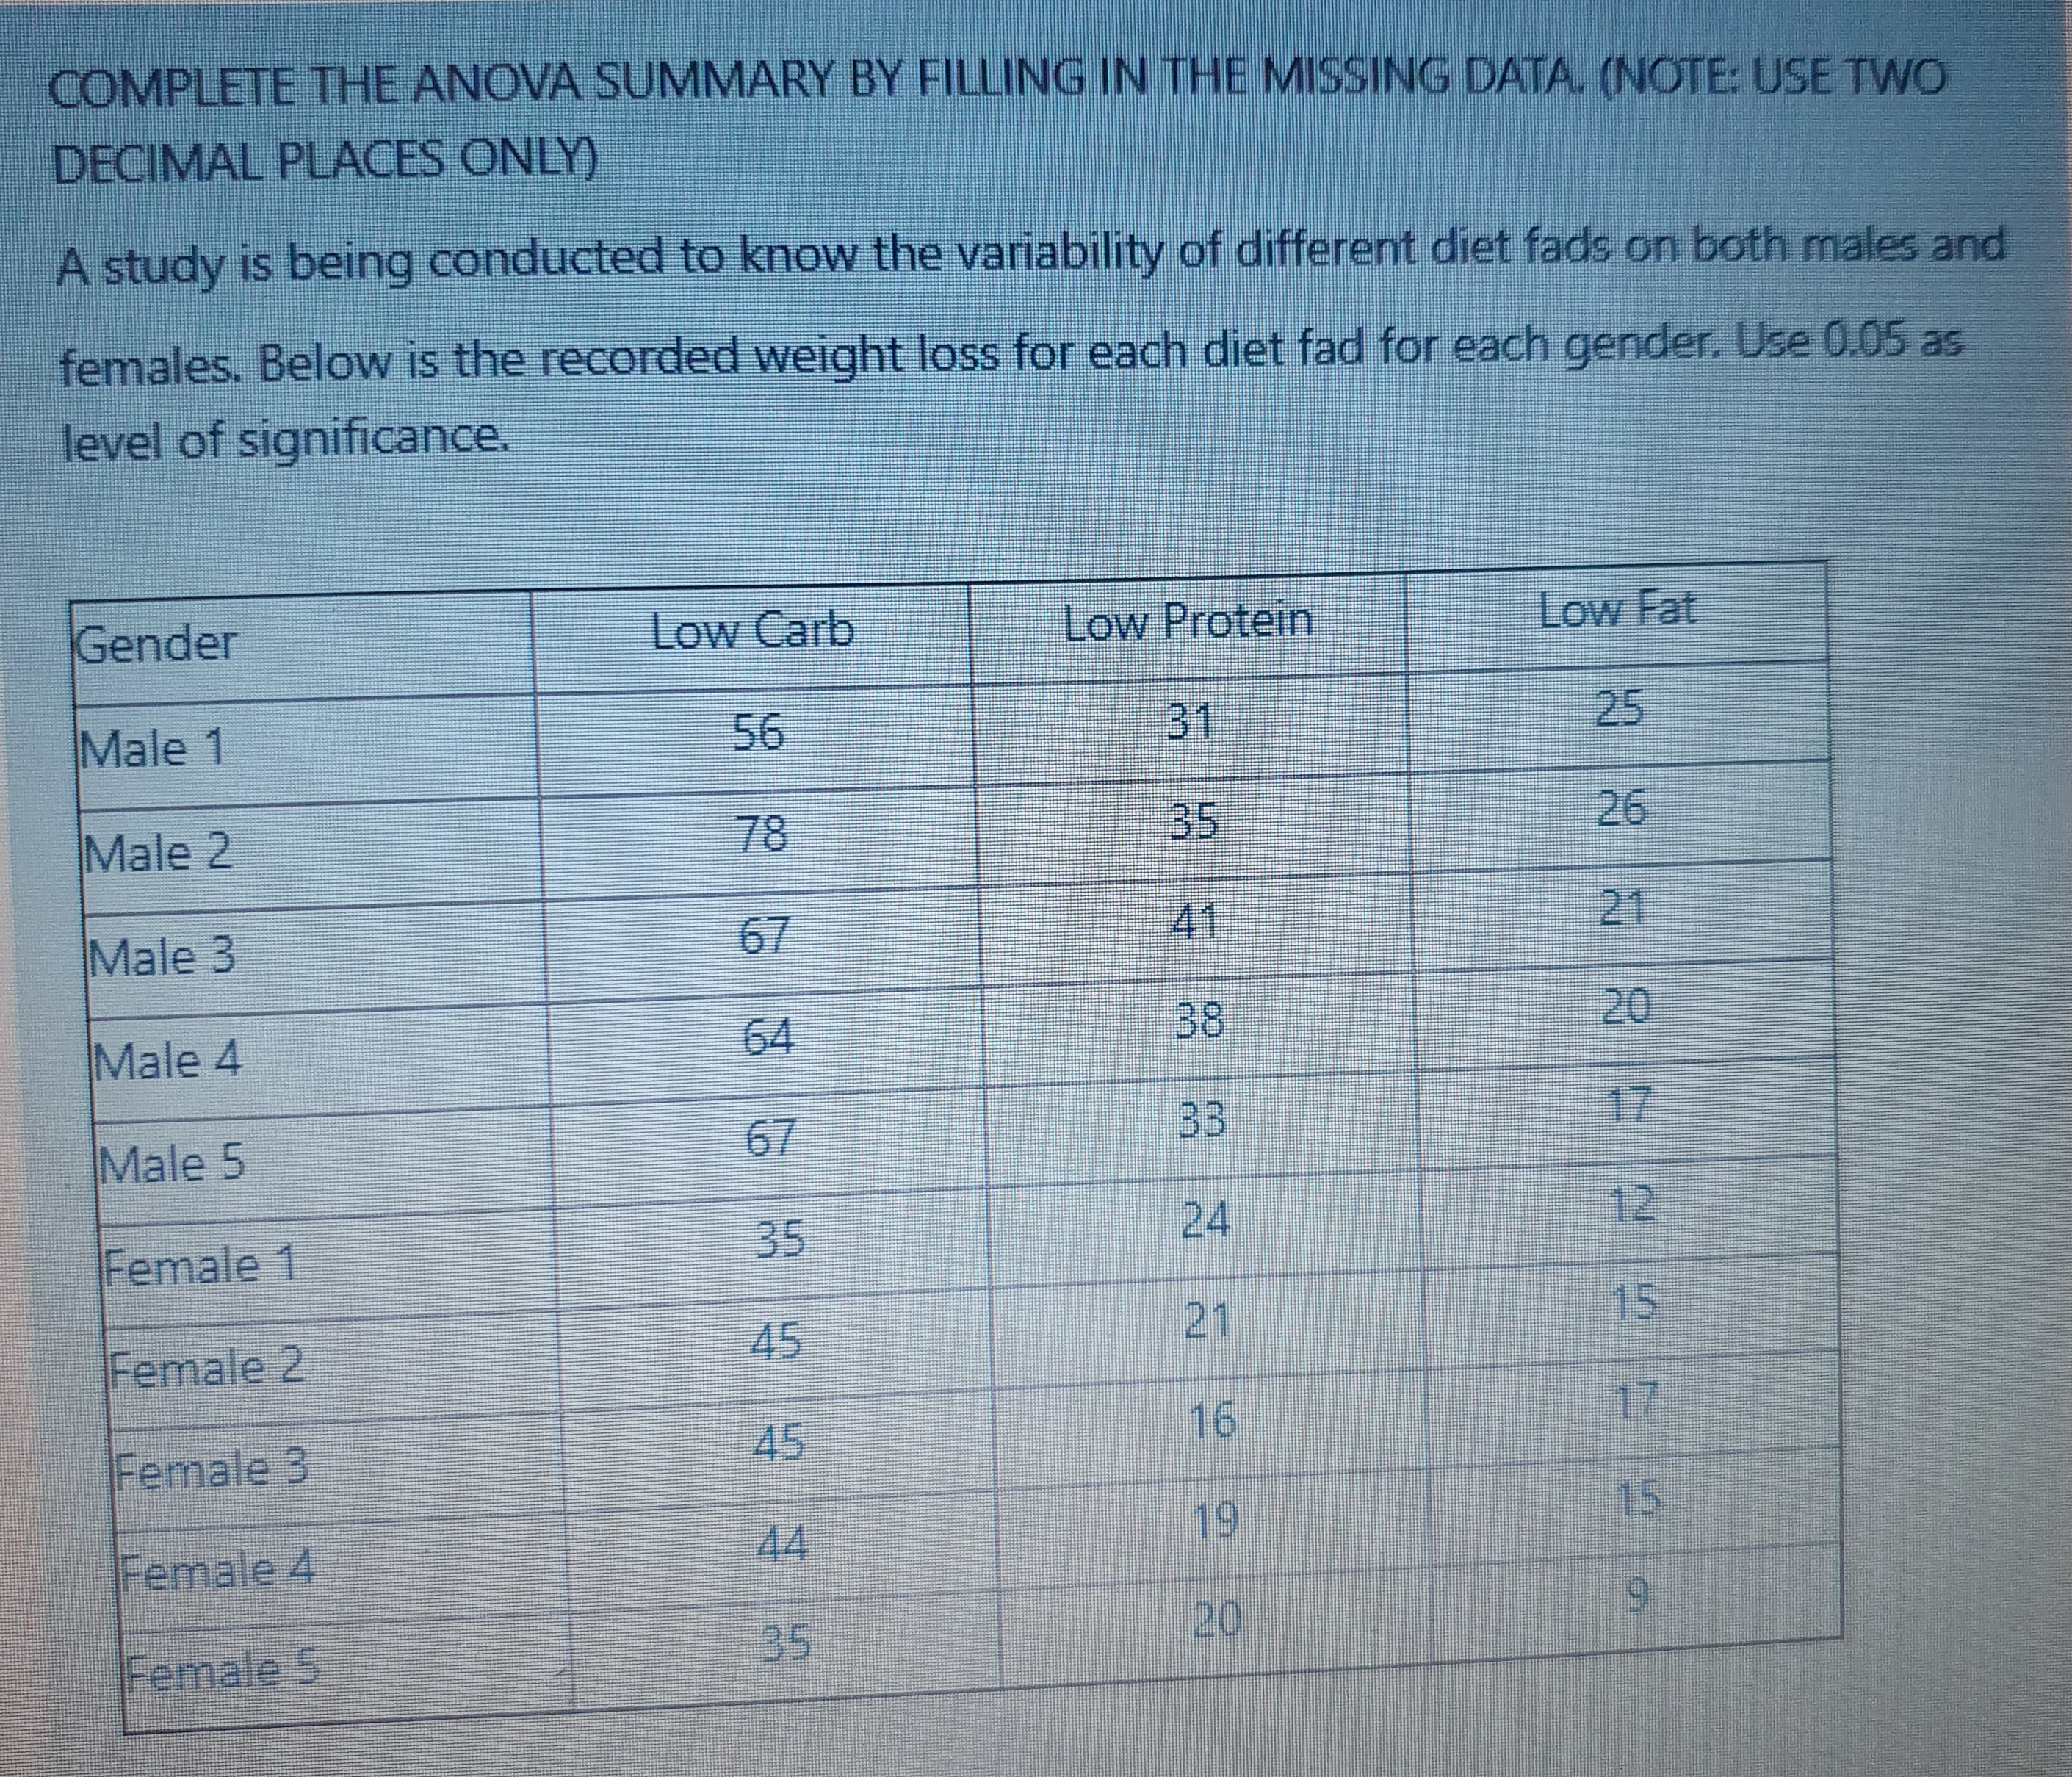
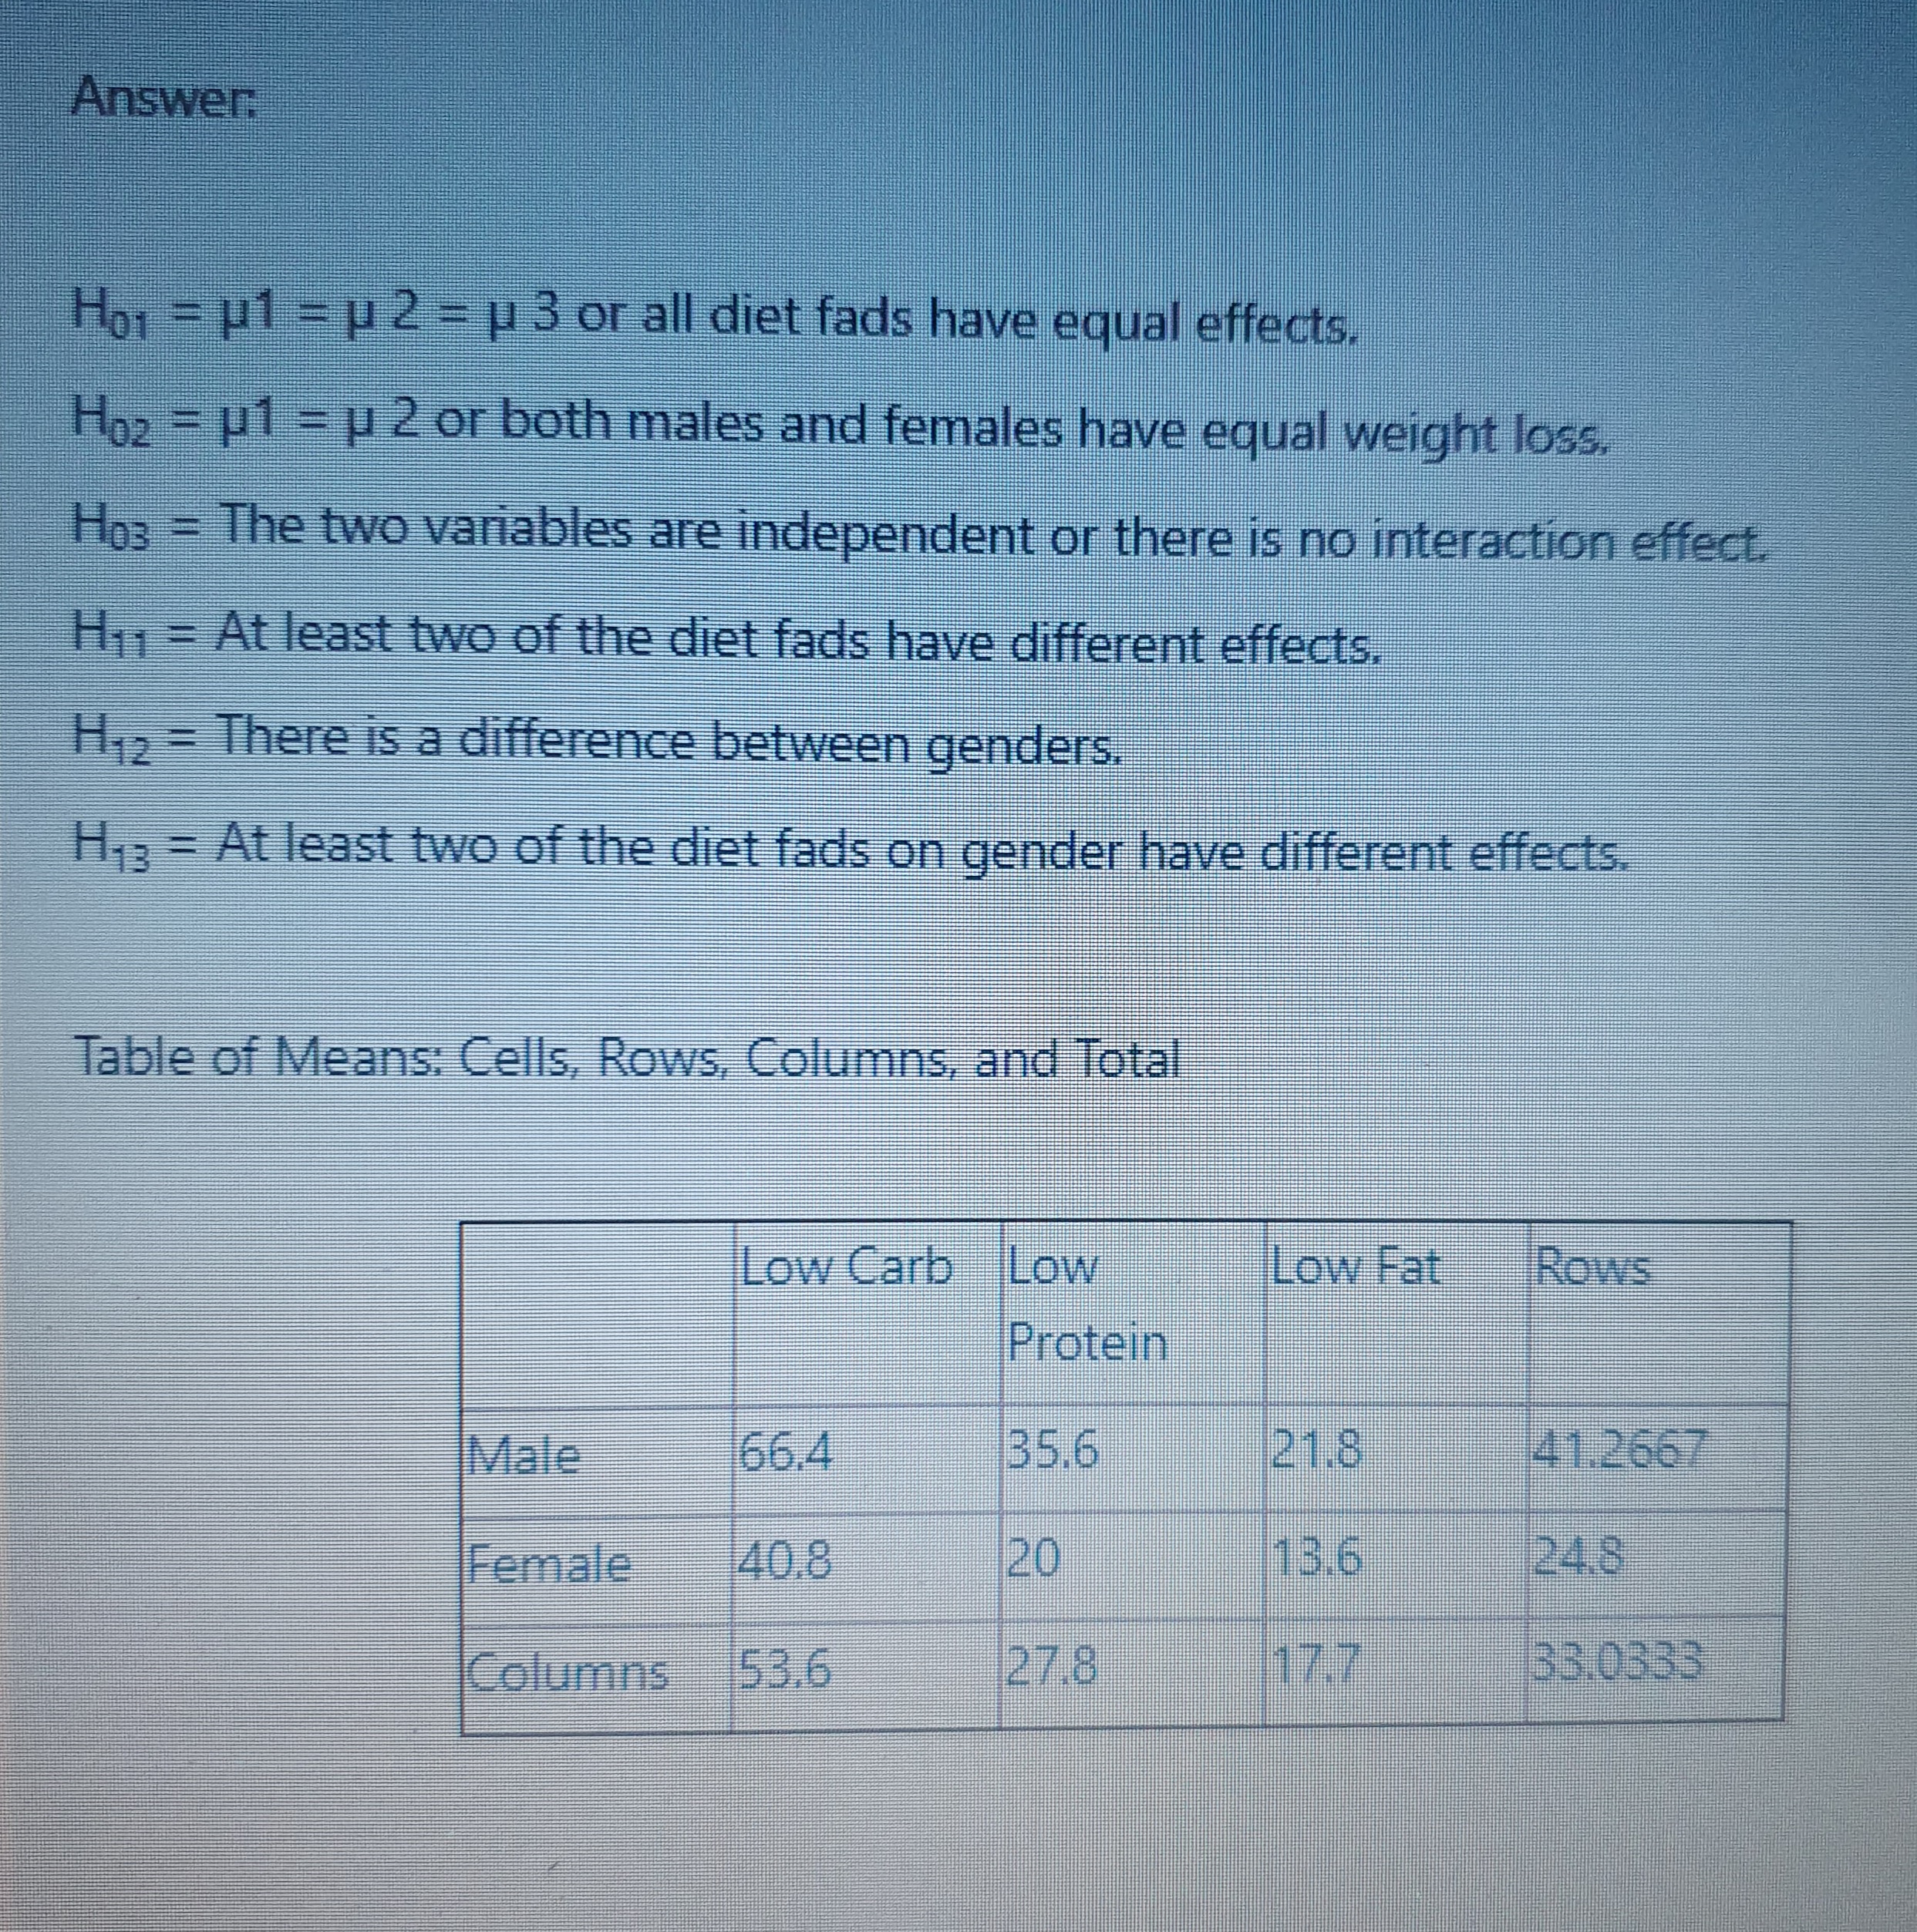
How to solve this data? I'm trying in excel but I can't find what formula to complete this? ANOVA Summary Source SS Df MS Gender

How to solve this data? I'm trying in excel but I can't find what formula to complete this?

image text in transcribedimage text in transcribedimage text in transcribed
ANOVA Summary Source SS Df MS Gender 40001 Diet fad 2 <.0001 gender x diet fad within groups total all results are significant at the p anova summary by filling in missing data. use two decimal places only a study is being conducted to know variability of different fads on both males and females. below recorded weight loss for each gender. as level significance. low carb protein fat male female hot="p1" or have equal effects hoz="1" females loss. hos="The" variables independent there no interaction effect. hi="At" least effects. hip="There" difference between genders. h13="At" table means: cells rows columns>

Step by Step Solution

There are 3 Steps involved in it

Step: 1

blur-text-image

Get Instant Access to Expert-Tailored Solutions

See step-by-step solutions with expert insights and AI powered tools for academic success

Step: 2

blur-text-image

Step: 3

blur-text-image

Ace Your Homework with AI

Get the answers you need in no time with our AI-driven, step-by-step assistance

Get Started

Recommended Textbook for

Algebra And Trigonometry Enhanced With Graphing Utilities (Subscription)

Authors: Michael, Michael Sullivan III, Michael III Sullivan, Michael Sullivan 111, III Sullivan

6th Edition

ISBN: 0321849132, 9780321849137

More Books

Students also viewed these Mathematics questions