Answered step by step
Verified Expert Solution
Question
1 Approved Answer
how would i go about turning my ARL to ANOS? Project Part III - ANOS Exploration: In Project Part II, ARL values were calculated for
how would i go about turning my ARL to ANOS? 
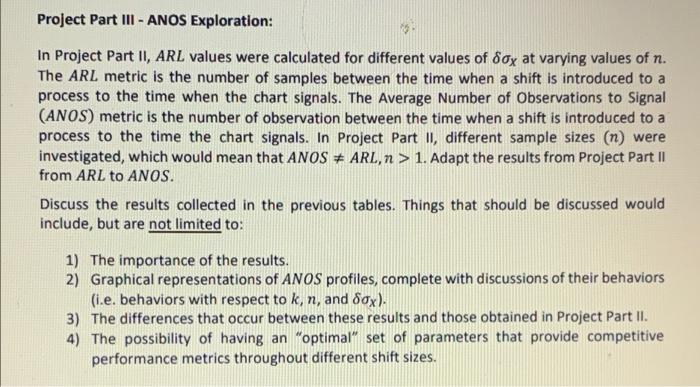
Project Part III - ANOS Exploration: In Project Part II, ARL values were calculated for different values of dax at varying values of n. The ARL metric is the number of samples between the time when a shift is introduced to a process to the time when the chart signals. The Average Number of Observations to Signal (ANOS) metric is the number of observation between the time when a shift is introduced to a process to the time the chart signals. In Project Part II, different sample sizes (n) were investigated, which would mean that ANOS #ARL, n > 1. Adapt the results from Project Part II from ARL to ANOS. Discuss the results collected in the previous tables. Things that should be discussed would include, but are not limited to: 1) The importance of the results. 2) Graphical representations of ANOS profiles, complete with discussions of their behaviors (i.e. behaviors with respect to k, n, and dox). 3) The differences that occur between these results and those obtained in Project Part II. 4) The possibility of having an "optimal" set of parameters that provide competitive performance metrics throughout different shift sizes. Project Part III - ANOS Exploration: In Project Part II, ARL values were calculated for different values of dax at varying values of n. The ARL metric is the number of samples between the time when a shift is introduced to a process to the time when the chart signals. The Average Number of Observations to Signal (ANOS) metric is the number of observation between the time when a shift is introduced to a process to the time the chart signals. In Project Part II, different sample sizes (n) were investigated, which would mean that ANOS #ARL, n > 1. Adapt the results from Project Part II from ARL to ANOS. Discuss the results collected in the previous tables. Things that should be discussed would include, but are not limited to: 1) The importance of the results. 2) Graphical representations of ANOS profiles, complete with discussions of their behaviors (i.e. behaviors with respect to k, n, and dox). 3) The differences that occur between these results and those obtained in Project Part II. 4) The possibility of having an "optimal" set of parameters that provide competitive performance metrics throughout different shift sizes 
Step by Step Solution
There are 3 Steps involved in it
Step: 1

Get Instant Access to Expert-Tailored Solutions
See step-by-step solutions with expert insights and AI powered tools for academic success
Step: 2

Step: 3

Ace Your Homework with AI
Get the answers you need in no time with our AI-driven, step-by-step assistance
Get Started


