Answered step by step
Verified Expert Solution
Question
1 Approved Answer
How would you solve this problem ? Ambrose Department Stores Inc, CEO has asked you to compare the companys profit performance and financial position with
How would you solve this problem ? 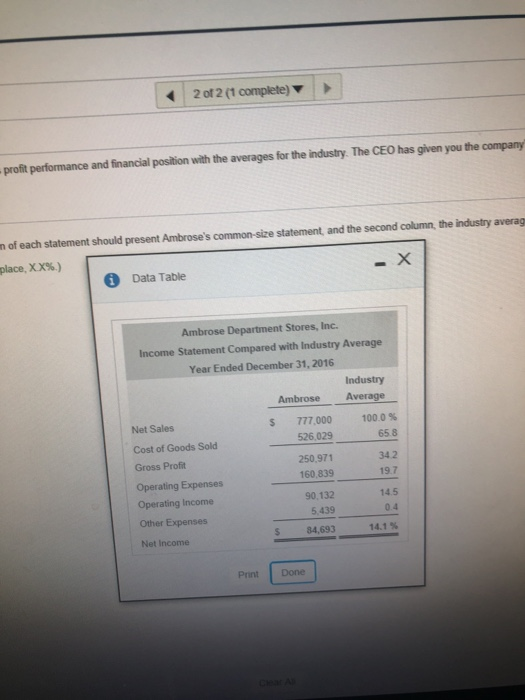
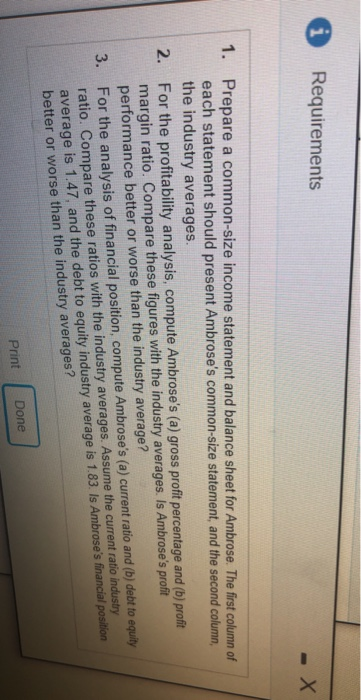
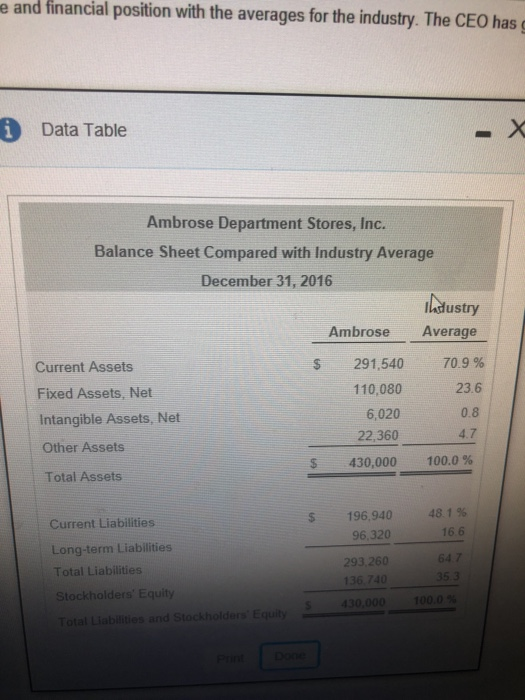
https://www.mathia Business I Homework: Chapter 15 Score: 0 of 1 pt P15-29A (similar to) The Ambrose Department Stores, Inc. chief executive officer (CEO) has asked you to compare the comp (Click the icon to view the income statement)(Click the icon to view the balance sheet) Read the requirements Requirement 1. Prepare a common-size income statement and balance sheet for Ambrose. The first colu Begin by preparing the common-size income statement for Ambrose. (Round your answers to one decimal Ambrose Department Stores, Inc. Common-Size Income Statement Year Ended December 31, 2016 Ambrose Industry Average Net Sales 100.0 % 658 34 2 % 19.7 14.5 % Cost of Goods Sold Gross Profit Operating Expenses Operating Income Other Expenses 0.4 Net Income 14.1 2 of 2 (1 complete) profit performance and financial position with the averages for the industry The CEO has given you the company n of each statement should present Ambrose's common-size statement, and the second column, the industry averag lace, XX%) Data Table Ambrose Department Stores, Inc. Income Statement Compared with Industry Average Year Ended December 31, 2016 Industry Average Ambrose Net Sales Cost of Goods Sold Gross Profit Operating Expenses Operating Income Other Expenses Net Income 777,000 526,029 250,971 160,839 90.132 5,439 S 84,693 100.0 % 65.8 342 19.7 14.5 0.4 14.1 % Print Done e and financial position with the averages for the industry. The CEO has Data Table Ambrose Department Stores, Inc. Balance Sheet Compared with Industry Average December 31, 2016 Iadustry Ambrose Average Current Assets Fixed Assets, Net Intangible Assets, Net Other Assets Total Assets s 291,540 70.9 % 110,080 6,020 22,360 23.6 0.8 4.7 $ 430,000 100.0 % Current Liabilities Long-term Liabilities Total Liabilities Stockholders Equity Total Liabilities and Stockholders Equity 196.940 96,320 293,260 136 740 430,000 100.0 481% 16.6 64 7 35 3 Ambrose Department Stores Inc, CEO has asked you to compare the companys profit performance and financial position with averages for the industry. CEO has given you the companys income statement and balance sheet as well as the industry average data for retailers. 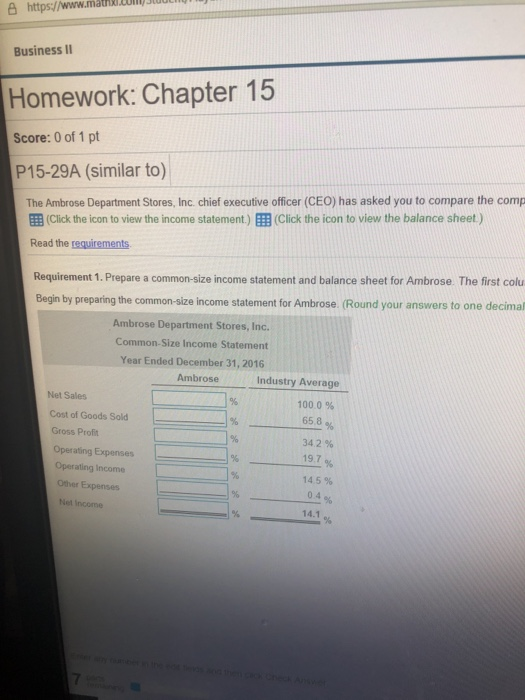
Step by Step Solution
There are 3 Steps involved in it
Step: 1

Get Instant Access to Expert-Tailored Solutions
See step-by-step solutions with expert insights and AI powered tools for academic success
Step: 2

Step: 3
Ace Your Homework with AI
Get the answers you need in no time with our AI-driven, step-by-step assistance
Get Started