Answered step by step
Verified Expert Solution
Question
1 Approved Answer
>> hsb_full.Im > hsb_red.Im > anova(hsb_full . Im) >> anova(hsb_red. Im, hsb_full. Im) Analysis of Variance Table Analysis of Variance Table Response: math Of Sum
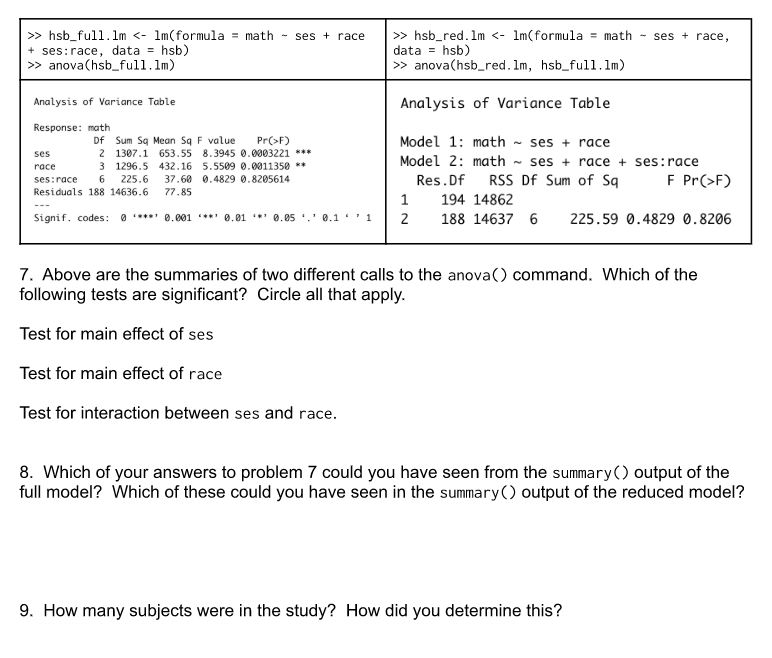
>> hsb_full.Im > hsb_red.Im > anova(hsb_full . Im) >> anova(hsb_red. Im, hsb_full. Im) Analysis of Variance Table Analysis of Variance Table Response: math Of Sum So Mean Sq F value Pr(>F) Model 1: math ~ ses + race ses 2 1307.1 653.55 8.3945 0.0003221 * * race 3 1296.5 432.16 5.5509 0.0911350 ** Model 2: math ~ ses + race + ses:race ses: race 6 225.6 37.60 0.4829 0.8205614 Res. Df RSS Df Sum of Sq F Pr(>F) Residuals 188 14636.6 77 .85 194 14862 N H Signif, codes: 0 .*#' 0.001 .* *' 0.01 ."' 0.05 '. ' 0.1 ' ' 1 188 14637 6 225.59 0. 4829 0.8206 7. Above are the summaries of two different calls to the anova() command. Which of the following tests are significant? Circle all that apply. Test for main effect of ses Test for main effect of race Test for interaction between ses and race. 8. Which of your answers to problem 7 could you have seen from the summary ( ) output of the full model? Which of these could you have seen in the summary () output of the reduced model? 9. How many subjects were in the study? How did you determine this
Step by Step Solution
There are 3 Steps involved in it
Step: 1
Get Instant Access to Expert-Tailored Solutions
See step-by-step solutions with expert insights and AI powered tools for academic success
Step: 2
Step: 3
Ace Your Homework with AI
Get the answers you need in no time with our AI-driven, step-by-step assistance
Get Started