 .
.
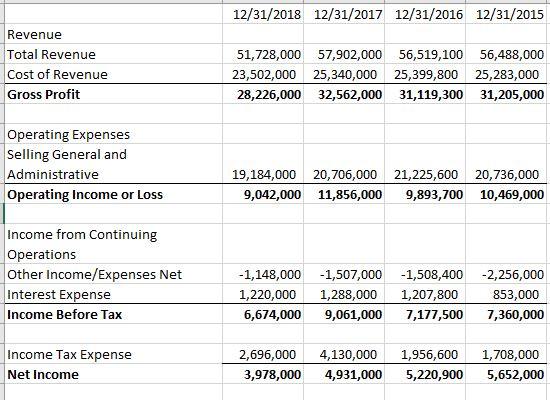
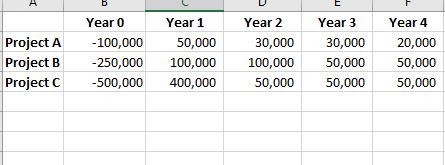
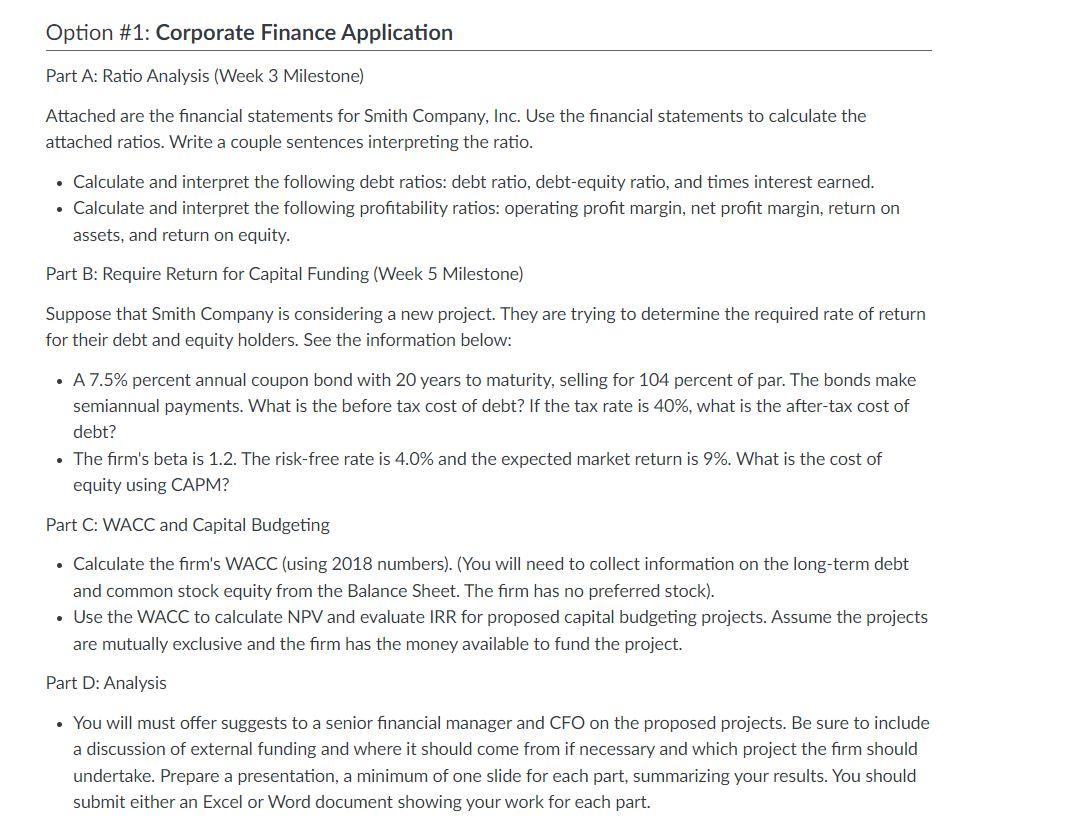
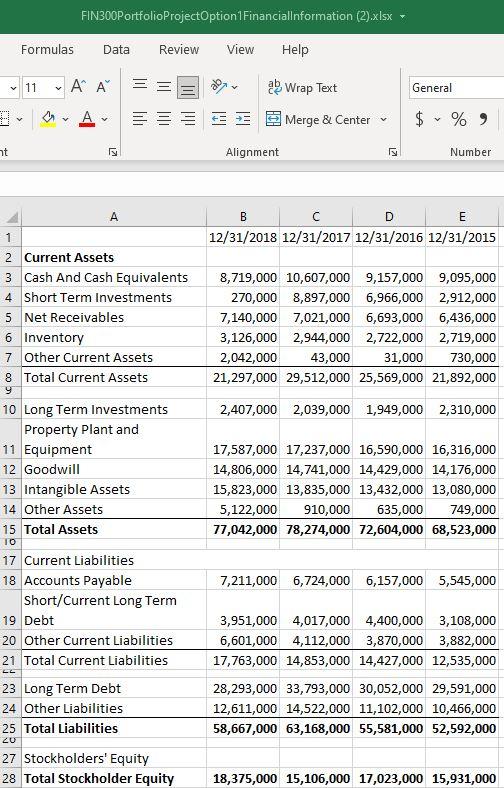
ht FIN300PortfolioProjectOption1 FinancialInformation (2).xlsx Review View Help ab Wrap Text Formulas Data 11 A A Y v v A v = A 1 2 Current Assets 3 Cash And Cash Equivalents 4 Short Term Investments 5 Net Receivables 6 Inventory 7 Other Current Assets 8 Total Current Assets 10 Long Term Investments Property Plant and 11 Equipment 12 Goodwill 13 Intangible Assets 14 Other Assets 15 Total Assets 10 17 Current Liabilities 18 Accounts Payable Short/Current Long Term 19 Debt 20 Other Current Liabilities 21 Total Current Liabilities LL 23 Long Term Debt 24 Other Liabilities 25 Total Liabilities 20 27 Stockholders' Equity 28 Total Stockholder Equity General $ % 9 Y Alignment F Number B E 12/31/2018 12/31/2017 12/31/2016 12/31/2015 8,719,000 10,607,000 9,157,000 9,095,000 270,000 8,897,000 6,966,000 2,912,000 7,140,000 7,021,000 6,693,000 6,436,000 3,126,000 2,944,000 2,722,000 2,719,000 2,042,000 43,000 31,000 730,000 21,297,000 29,512,000 25,569,000 21,892,000 2,407,000 2,039,000 1,949,000 2,310,000 17,587,000 17,237,000 16,590,000 16,316,000 14,806,000 14,741,000 14,429,000 14,176,000 15,823,000 13,835,000 13,432,000 13,080,000 5,122,000 910,000 635,000 749,000 77,042,000 78,274,000 72,604,000 68,523,000 7,211,000 6,724,000 6,157,000 5,545,000 3,951,000 4,017,000 4,400,000 3,108,000 6,601,000 4,112,000 3,870,000 3,882,000 17,763,000 14,853,000 14,427,000 12,535,000 28,293,000 33,793,000 30,052,000 29,591,000 12,611,000 14,522,000 11,102,000 10,466,000 58,667,000 63,168,000 55,581,000 52,592,000 18,375,000 15,106,000 17,023,000 15,931,000 Merge & Center Revenue Total Revenue Cost of Revenue Gross Profit Operating Expenses Selling General and Administrative Operating Income or Loss Income from Continuing Operations Other Income/Expenses Net Interest Expense Income Before Tax Income Tax Expense Net Income 12/31/2018 12/31/2017 12/31/2016 12/31/2015 51,728,000 57,902,000 56,519,100 56,488,000 23,502,000 25,340,000 25,399,800 25,283,000 28,226,000 32,562,000 31,119,300 31,205,000 19,184,000 20,706,000 21,225,600 20,736,000 9,042,000 11,856,000 9,893,700 10,469,000 -1,148,000 -1,507,000 -1,508,400 -2,256,000 1,220,000 1,288,000 1,207,800 853,000 6,674,000 9,061,000 7,177,500 7,360,000 2,696,000 4,130,000 1,956,600 1,708,000 3,978,000 4,931,000 5,220,900 5,652,000 F Year 0 Project A -100,000 Project B -250,000 Project C -500,000 Year 1 50,000 100,000 400,000 Year 2 30,000 100,000 50,000 Year 3 30,000 50,000 50,000 Year 4 20,000 50,000 50,000 Option #1: Corporate Finance Application Part A: Ratio Analysis (Week 3 Milestone) Attached are the financial statements for Smith Company, Inc. Use the financial statements to calculate the attached ratios. Write a couple sentences interpreting the ratio. Calculate and interpret the following debt ratios: debt ratio, debt-equity ratio, and times interest earned. Calculate and interpret the following profitability ratios: operating profit margin, net profit margin, return on assets, and return on equity. Part B: Require Return for Capital Funding (Week 5 Milestone) Suppose that Smith Company is considering a new project. They are trying to determine the required rate of return for their debt and equity holders. See the information below: . A 7.5% percent annual coupon bond with 20 years to maturity, selling for 104 percent of par. The bonds make semiannual payments. What is the before tax cost of debt? If the tax rate is 40%, what is the after-tax cost of debt? The firm's beta is 1.2. The risk-free rate is 4.0% and the expected market return is 9%. What is the cost of equity using CAPM? Part C: WACC and Capital Budgeting Calculate the firm's WACC (using 2018 numbers). (You will need to collect information on the long-term debt and common stock equity from the Balance Sheet. The firm has no preferred stock). Use the WACC to calculate NPV and evaluate IRR for proposed capital budgeting projects. Assume the projects are mutually exclusive and the firm has the money available to fund the project. Part D: Analysis You will must offer suggests to a senior financial manager and CFO on the proposed projects. Be sure to include a discussion of external funding and where it should come from if necessary and which project the firm should undertake. Prepare a presentation, a minimum of one slide for each part, summarizing your results. You should submit either an Excel or Word document showing your work for each part. ht FIN300PortfolioProjectOption1 FinancialInformation (2).xlsx Review View Help ab Wrap Text Formulas Data 11 A A Y v v A v = A 1 2 Current Assets 3 Cash And Cash Equivalents 4 Short Term Investments 5 Net Receivables 6 Inventory 7 Other Current Assets 8 Total Current Assets 10 Long Term Investments Property Plant and 11 Equipment 12 Goodwill 13 Intangible Assets 14 Other Assets 15 Total Assets 10 17 Current Liabilities 18 Accounts Payable Short/Current Long Term 19 Debt 20 Other Current Liabilities 21 Total Current Liabilities LL 23 Long Term Debt 24 Other Liabilities 25 Total Liabilities 20 27 Stockholders' Equity 28 Total Stockholder Equity General $ % 9 Y Alignment F Number B E 12/31/2018 12/31/2017 12/31/2016 12/31/2015 8,719,000 10,607,000 9,157,000 9,095,000 270,000 8,897,000 6,966,000 2,912,000 7,140,000 7,021,000 6,693,000 6,436,000 3,126,000 2,944,000 2,722,000 2,719,000 2,042,000 43,000 31,000 730,000 21,297,000 29,512,000 25,569,000 21,892,000 2,407,000 2,039,000 1,949,000 2,310,000 17,587,000 17,237,000 16,590,000 16,316,000 14,806,000 14,741,000 14,429,000 14,176,000 15,823,000 13,835,000 13,432,000 13,080,000 5,122,000 910,000 635,000 749,000 77,042,000 78,274,000 72,604,000 68,523,000 7,211,000 6,724,000 6,157,000 5,545,000 3,951,000 4,017,000 4,400,000 3,108,000 6,601,000 4,112,000 3,870,000 3,882,000 17,763,000 14,853,000 14,427,000 12,535,000 28,293,000 33,793,000 30,052,000 29,591,000 12,611,000 14,522,000 11,102,000 10,466,000 58,667,000 63,168,000 55,581,000 52,592,000 18,375,000 15,106,000 17,023,000 15,931,000 Merge & Center Revenue Total Revenue Cost of Revenue Gross Profit Operating Expenses Selling General and Administrative Operating Income or Loss Income from Continuing Operations Other Income/Expenses Net Interest Expense Income Before Tax Income Tax Expense Net Income 12/31/2018 12/31/2017 12/31/2016 12/31/2015 51,728,000 57,902,000 56,519,100 56,488,000 23,502,000 25,340,000 25,399,800 25,283,000 28,226,000 32,562,000 31,119,300 31,205,000 19,184,000 20,706,000 21,225,600 20,736,000 9,042,000 11,856,000 9,893,700 10,469,000 -1,148,000 -1,507,000 -1,508,400 -2,256,000 1,220,000 1,288,000 1,207,800 853,000 6,674,000 9,061,000 7,177,500 7,360,000 2,696,000 4,130,000 1,956,600 1,708,000 3,978,000 4,931,000 5,220,900 5,652,000 F Year 0 Project A -100,000 Project B -250,000 Project C -500,000 Year 1 50,000 100,000 400,000 Year 2 30,000 100,000 50,000 Year 3 30,000 50,000 50,000 Year 4 20,000 50,000 50,000 Option #1: Corporate Finance Application Part A: Ratio Analysis (Week 3 Milestone) Attached are the financial statements for Smith Company, Inc. Use the financial statements to calculate the attached ratios. Write a couple sentences interpreting the ratio. Calculate and interpret the following debt ratios: debt ratio, debt-equity ratio, and times interest earned. Calculate and interpret the following profitability ratios: operating profit margin, net profit margin, return on assets, and return on equity. Part B: Require Return for Capital Funding (Week 5 Milestone) Suppose that Smith Company is considering a new project. They are trying to determine the required rate of return for their debt and equity holders. See the information below: . A 7.5% percent annual coupon bond with 20 years to maturity, selling for 104 percent of par. The bonds make semiannual payments. What is the before tax cost of debt? If the tax rate is 40%, what is the after-tax cost of debt? The firm's beta is 1.2. The risk-free rate is 4.0% and the expected market return is 9%. What is the cost of equity using CAPM? Part C: WACC and Capital Budgeting Calculate the firm's WACC (using 2018 numbers). (You will need to collect information on the long-term debt and common stock equity from the Balance Sheet. The firm has no preferred stock). Use the WACC to calculate NPV and evaluate IRR for proposed capital budgeting projects. Assume the projects are mutually exclusive and the firm has the money available to fund the project. Part D: Analysis You will must offer suggests to a senior financial manager and CFO on the proposed projects. Be sure to include a discussion of external funding and where it should come from if necessary and which project the firm should undertake. Prepare a presentation, a minimum of one slide for each part, summarizing your results. You should submit either an Excel or Word document showing your work for each part
 .
.


