https://ccnymailcuny-my.sharepoint.com/:x:/g/personal/malam008_citymail_cuny_edu/EWFp3-LrfZxBsKztt5GAELoB55LHrDL_sVO_NaOJ1N-0ew?e=qNt1jA
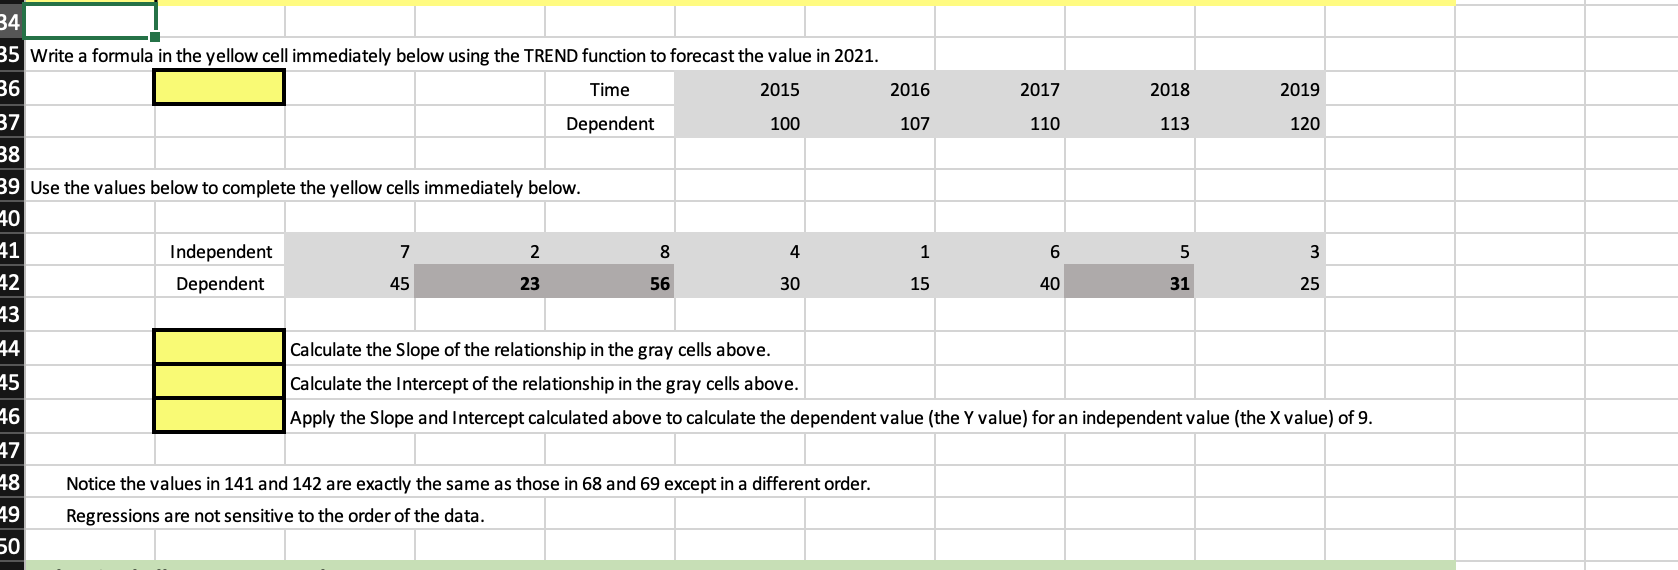
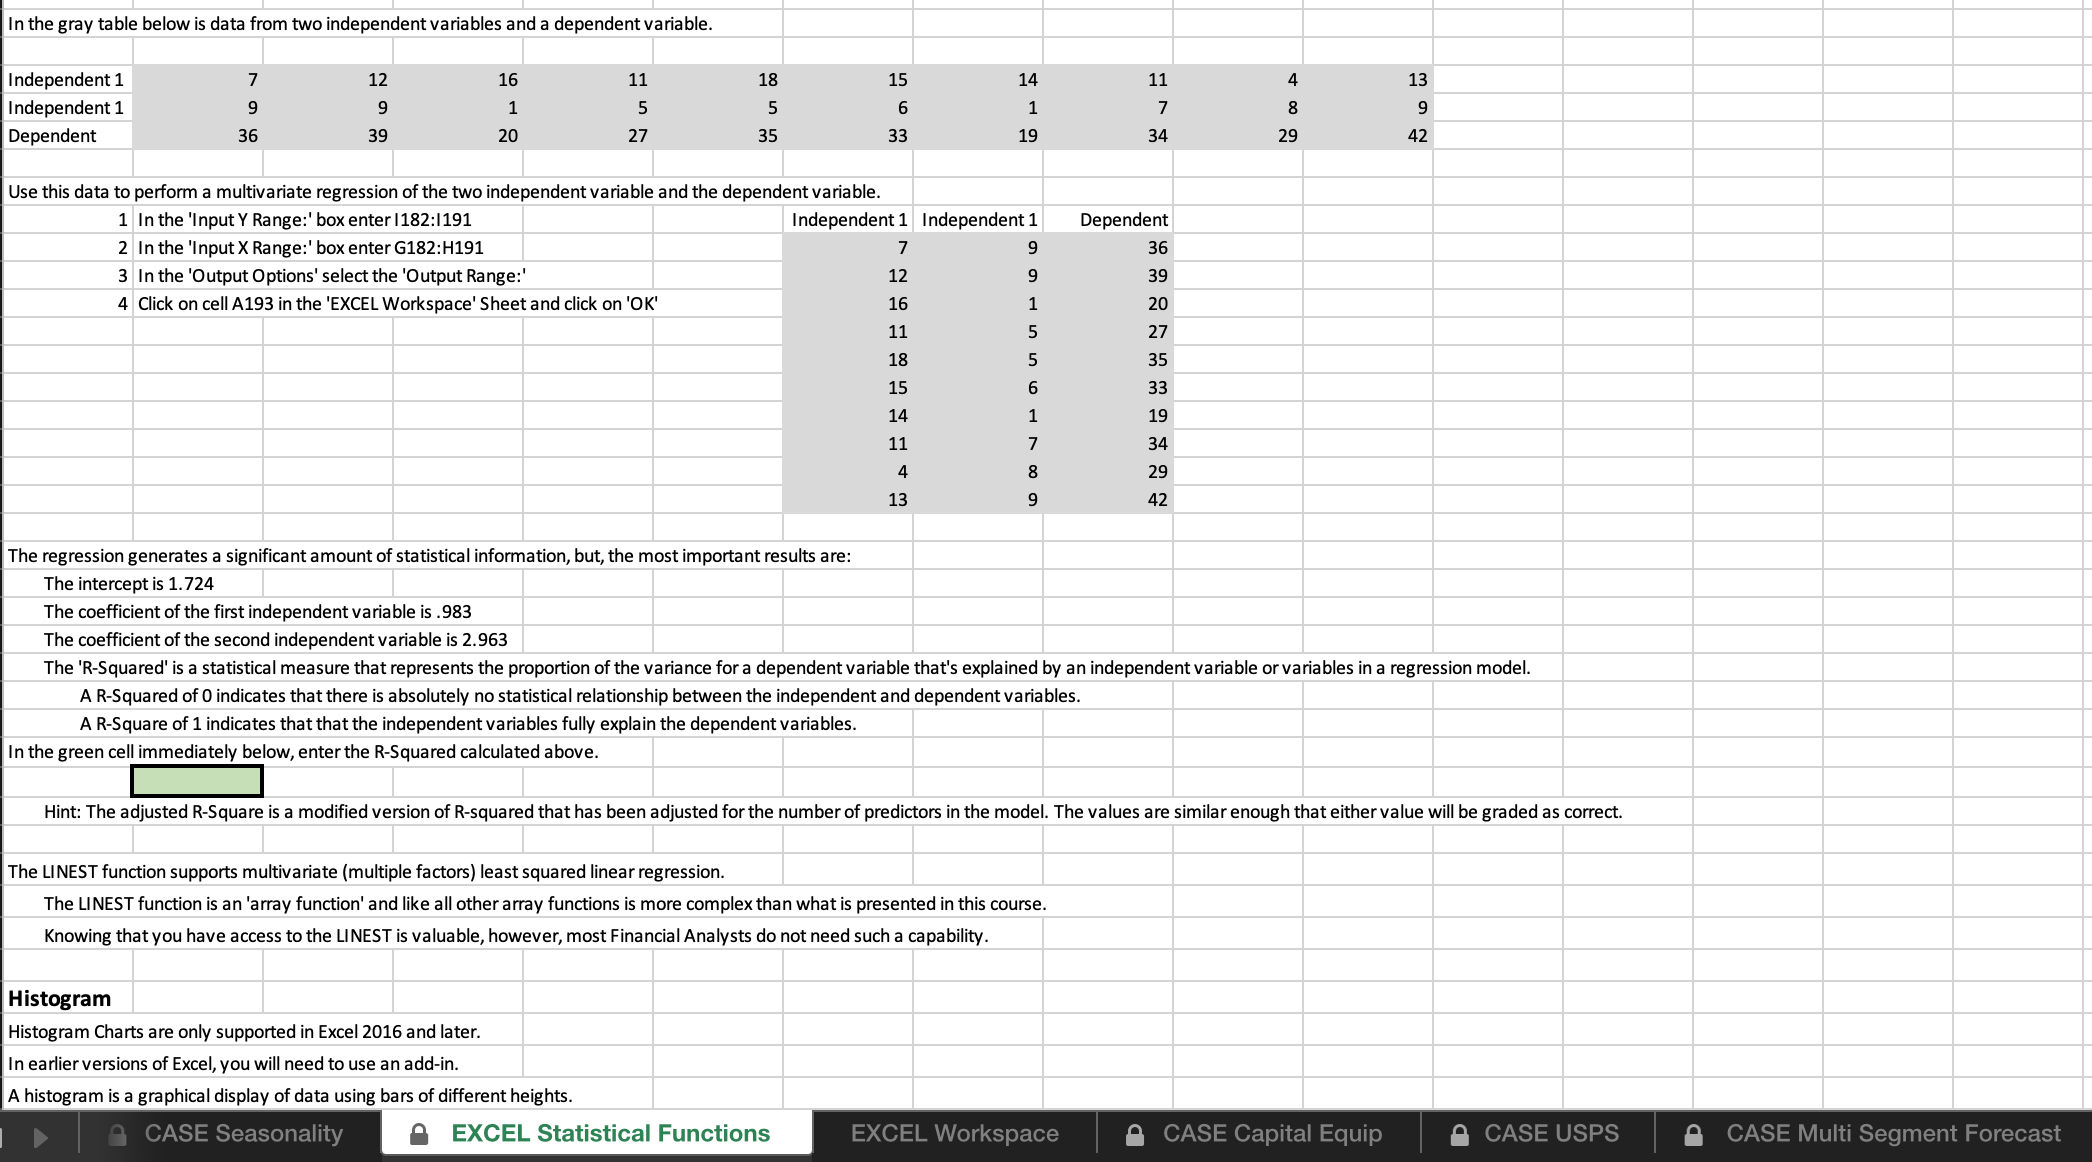
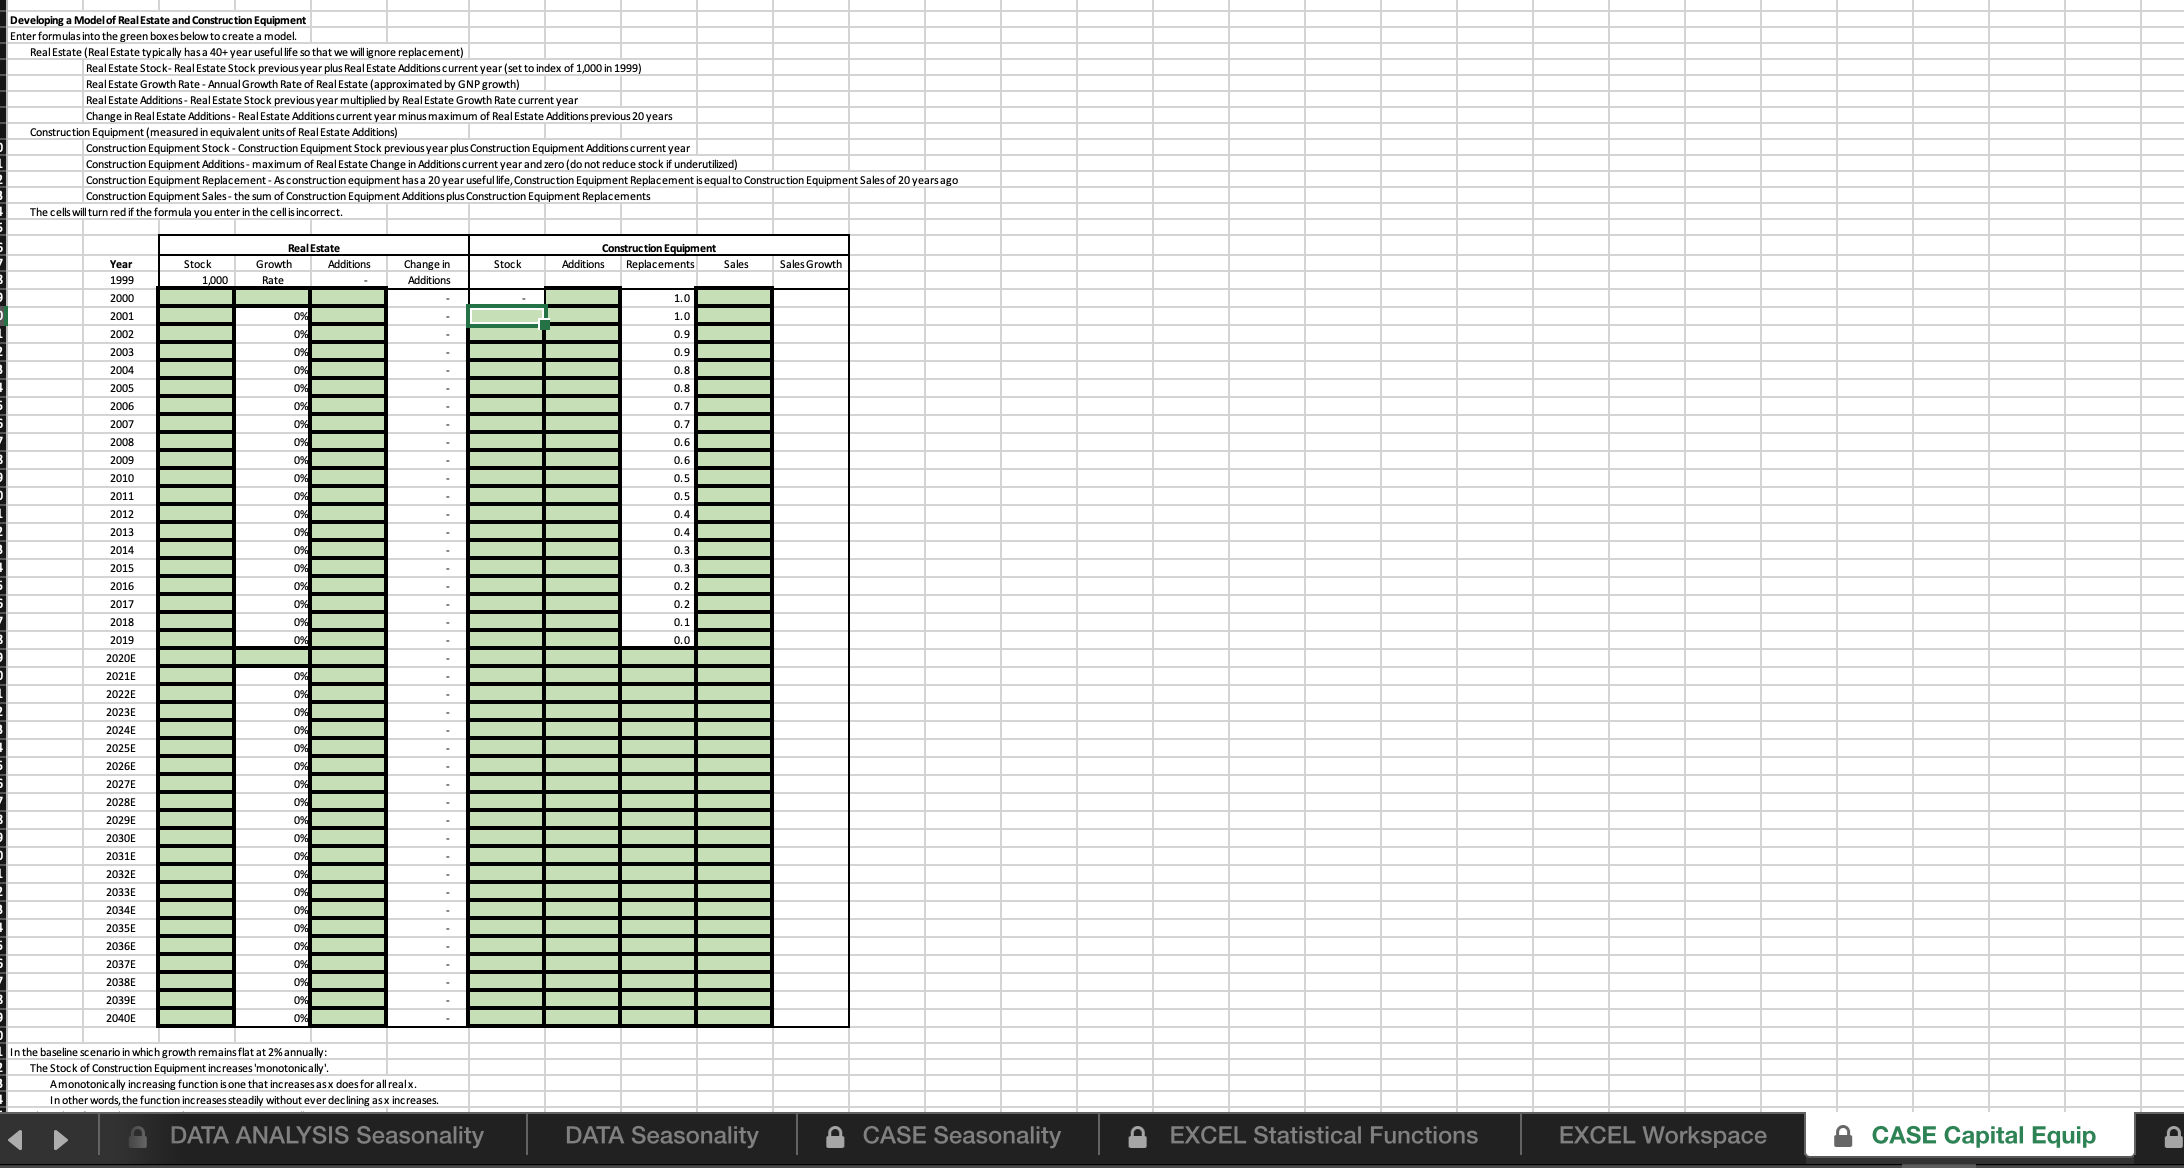
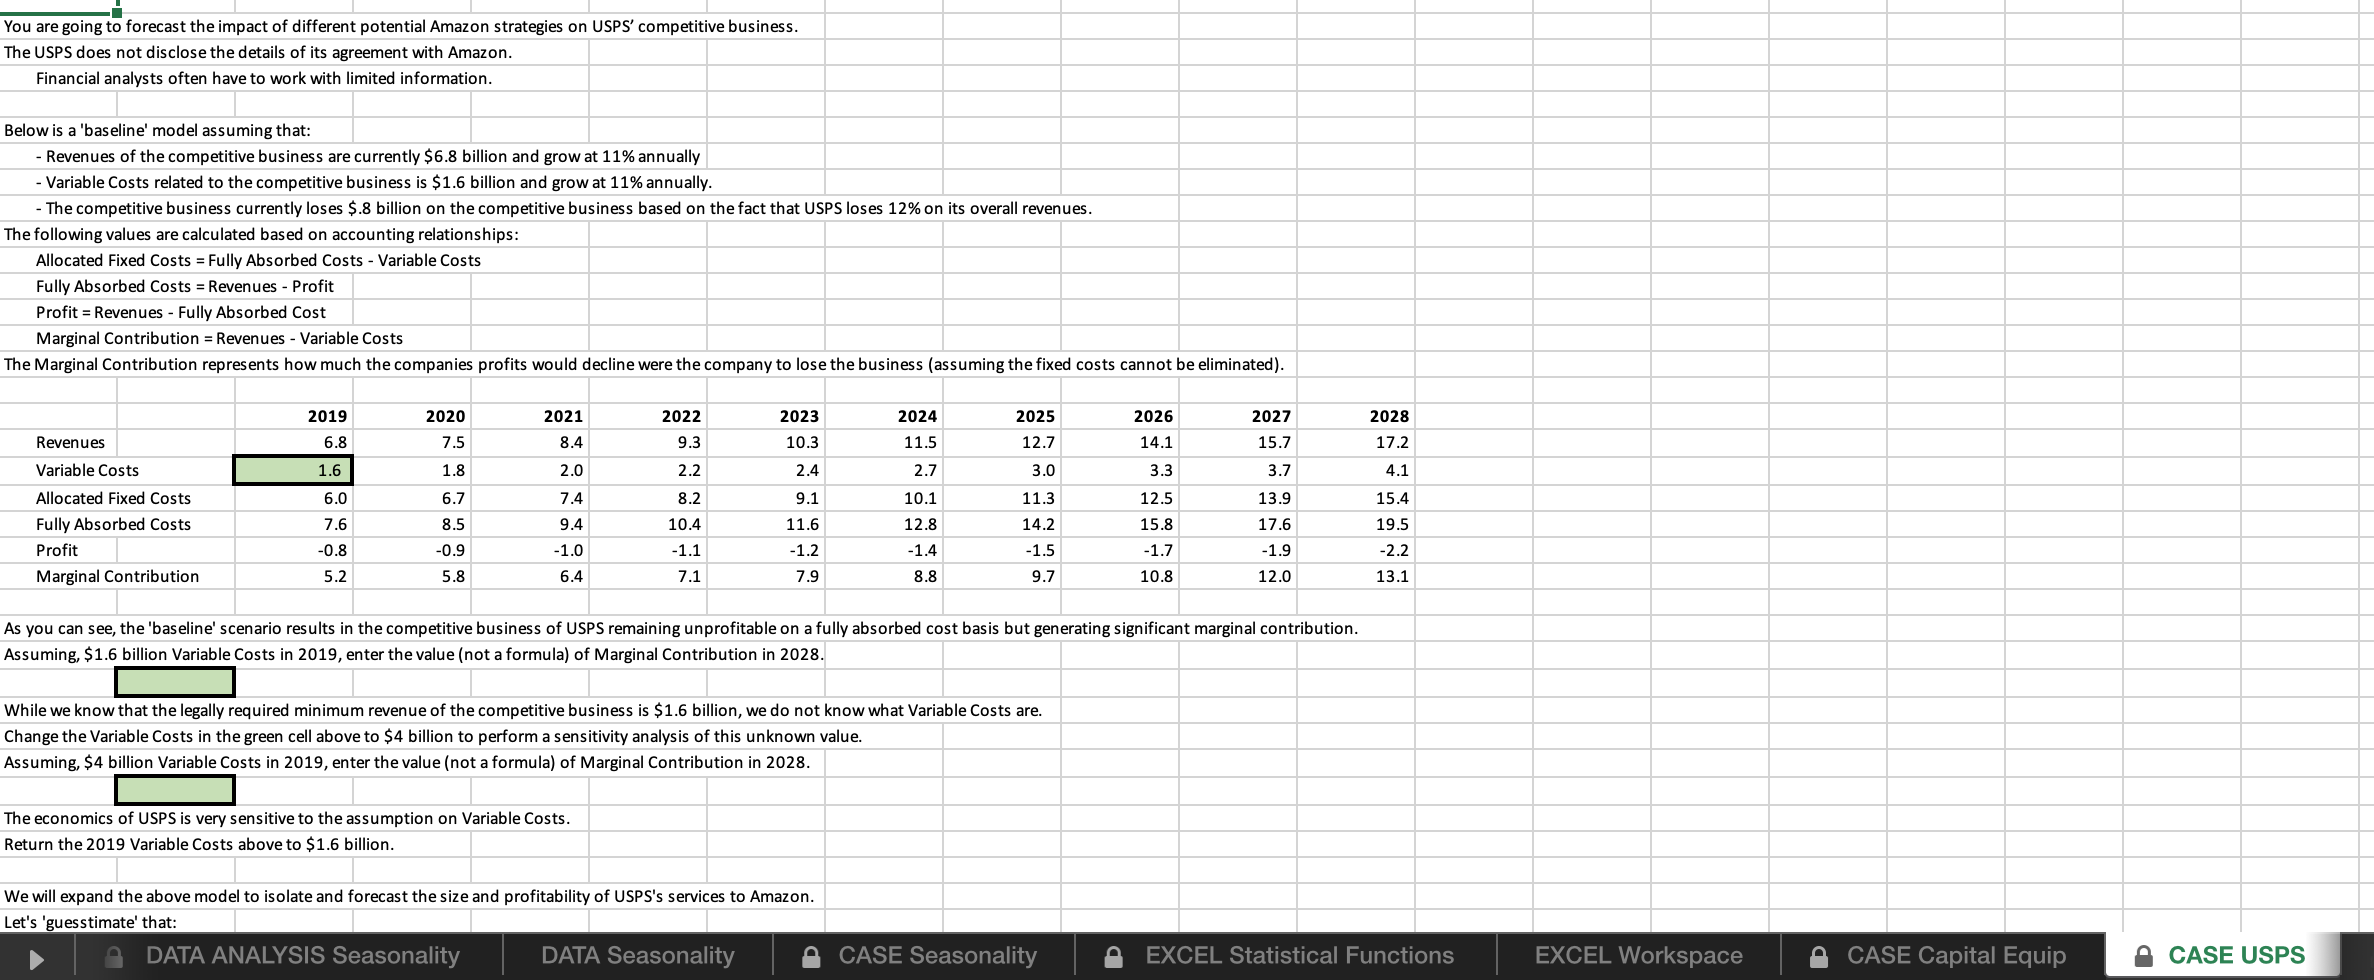
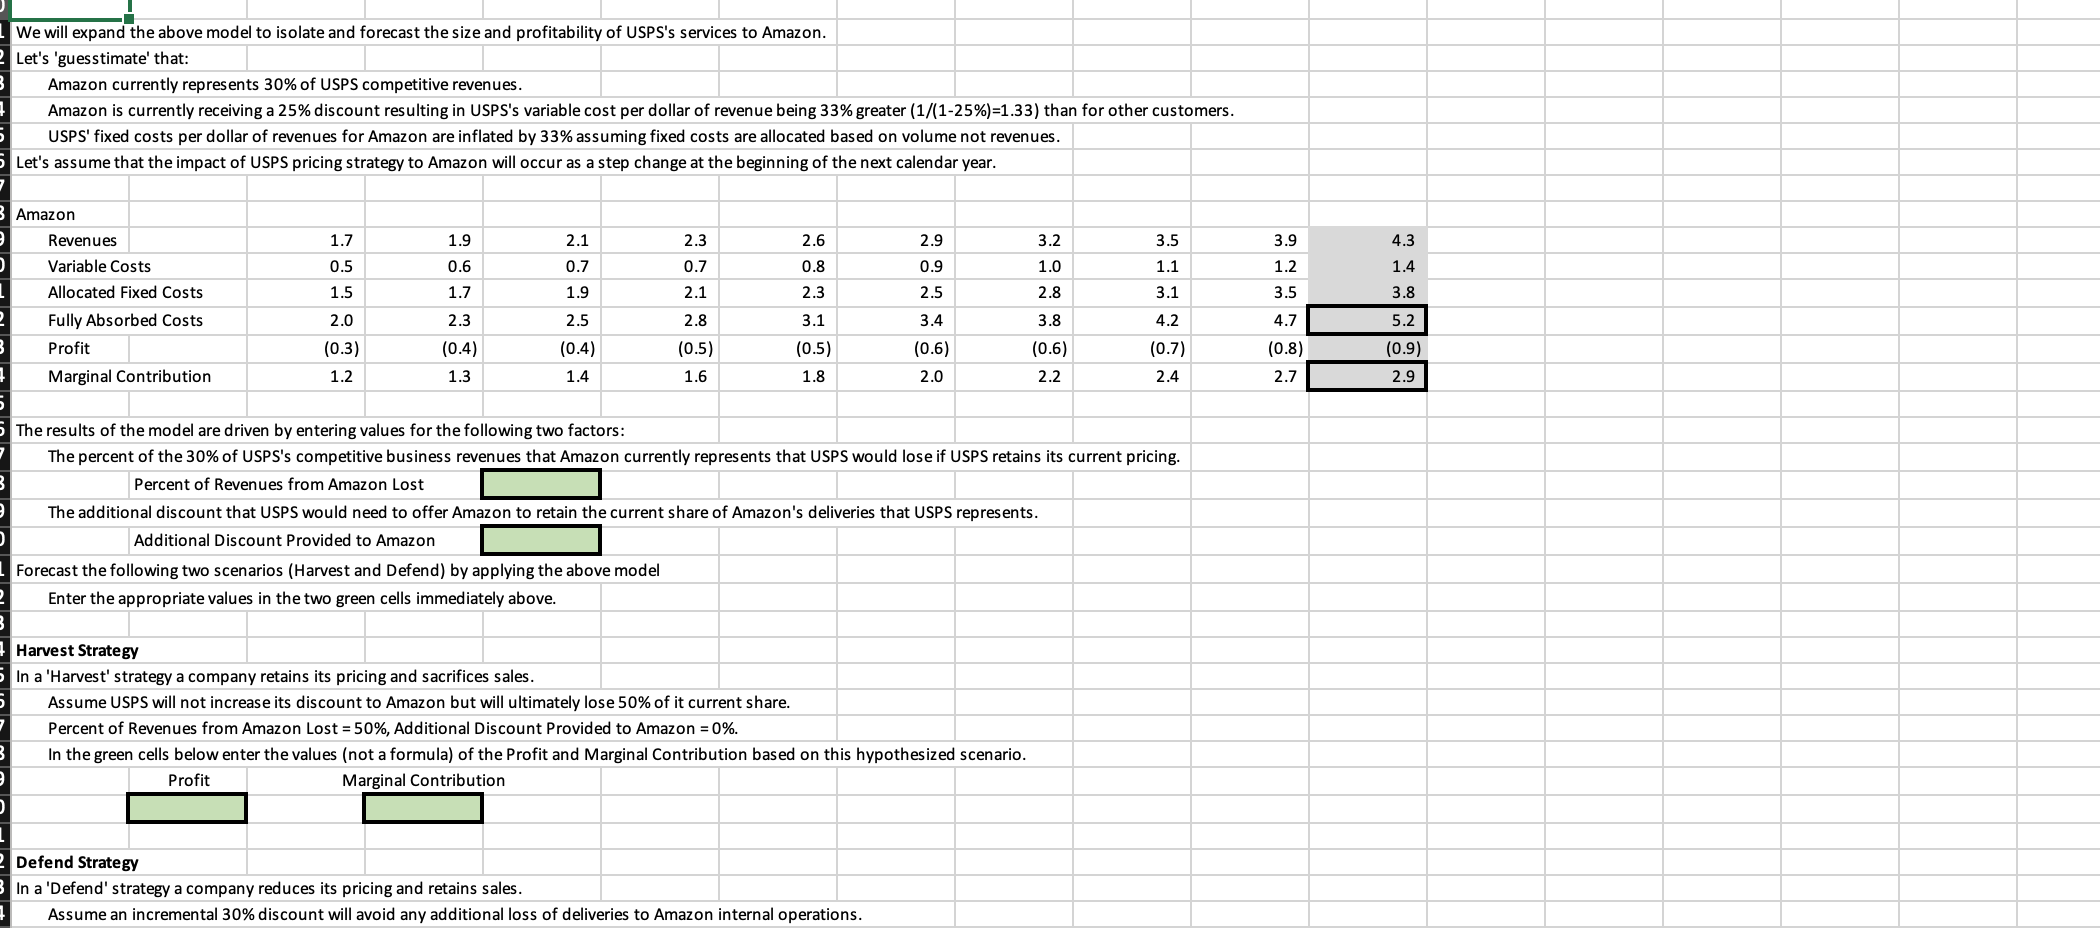
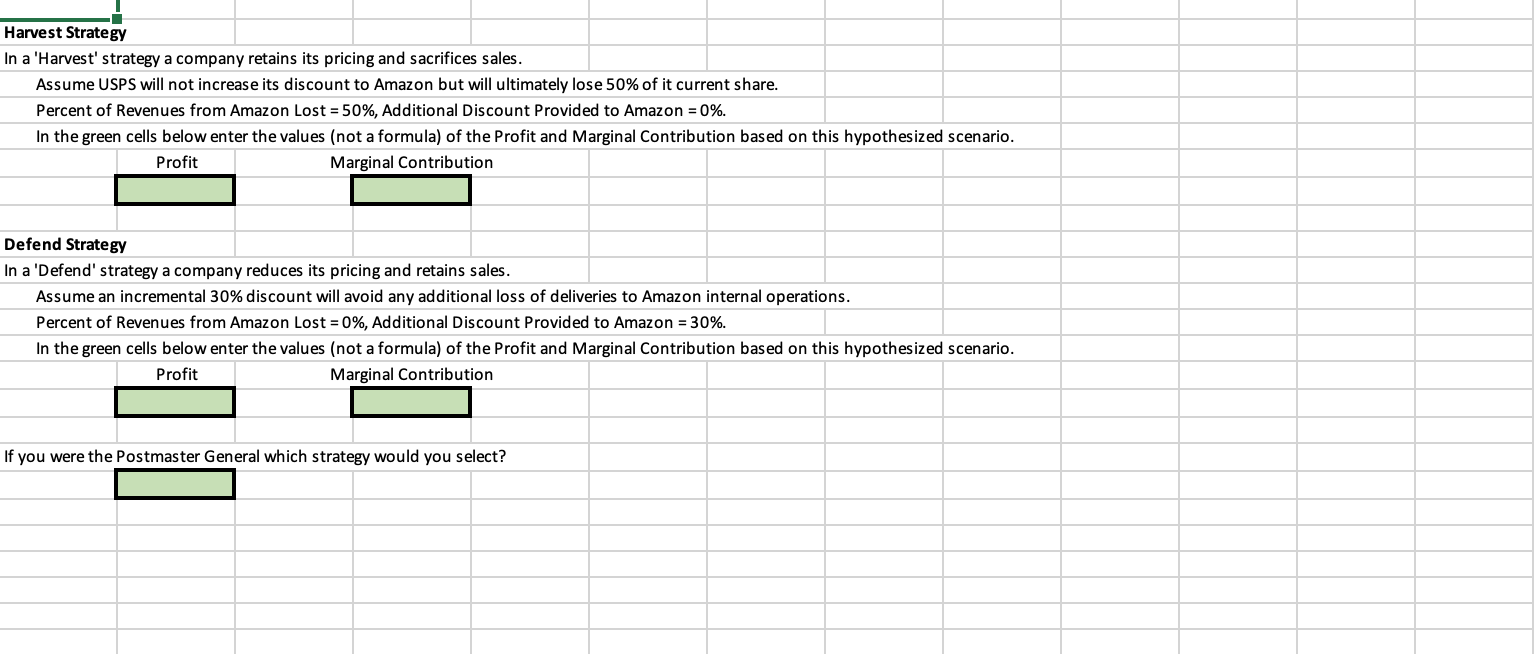
84 5 Write a formula in the yellow cell immediately below using the TREND function to forecast the value in 2021. 86 Time 2015 2016 2017 2018 2019 87 Dependent 100 107 110 113 120 Use the values below to complete the yellow cells immediately below. 40 Independent 2 8 4 1 6 5 3 42 Dependent 45 23 56 30 15 40 31 25 43 Calculate the Slope of the relationship in the gray cells above. 45 Calculate the Intercept of the relationship in the gray cells above. 46 Apply the Slope and Intercept calculated above to calculate the dependent value (the Y value) for an independent value (the X value) of 9. 48 Notice the values in 141 and 142 are exactly the same as those in 68 and 69 except in a different order. 49 Regressions are not sensitive to the order of the data. 50In the gray table below is data from two independent variables and a dependent variable. Independent 1 12 16 11 18 15 14 11 13 Independent 1 5 6 1 00 Dependent 36 39 20 27 35 33 19 34 29 42 Use this data to perform a multivariate regression of the two independent variable and the dependent variable. 1 In the 'Input Y Range:' box enter |182:1191 Independent 1 Independent 1 Dependent 2 In the 'Input X Range:' box enter G182:H191 36 3 In the 'Output Options' select the 'Output Range:" 12 39 4 Click on cell A193 in the 'EXCEL Workspace' Sheet and click on 'OK' 16 20 11 27 18 35 15 33 14 19 11 34 4 NHAUUHID 13 00 29 42 The regression generates a significant amount of statistical information, but, the most important results are: The intercept is 1.724 The coefficient of the first independent variable is .983 The coefficient of the second independent variable is 2.963 The 'R-Squared' is a statistical measure that represents the proportion of the variance for a dependent variable that's explained by an independent variable or variables in a regression model. A R-Squared of O indicates that there is absolutely no statistical relationship between the independent and dependent variables. A R-Square of 1 indicates that that the independent variables fully explain the dependent variables. In the green cell immediately below, enter the R-Squared calculated above. Hint: The adjusted R-Square is a modified version of R-squared that has been adjusted for the number of predictors in the model. The values are similar enough that either value will be graded as correct. The LINEST function supports multivariate (multiple factors) least squared linear regression. The LINEST function is an 'array function' and like all other array functions is more complex than what is presented in this course. Knowing that you have access to the LINEST is valuable, however, most Financial Analysts do not need such a capability. Histogram Histogram Charts are only supported in Excel 2016 and later. In earlier versions of Excel, you will need to use an add-in. A histogram is a graphical display of data using bars of different heights. A CASE Seasonality EXCEL Statistical Functions EXCEL Workspace CASE Capital Equip A CASE USPS A CASE Multi Segment ForecastDeveloping a Model of Real Estate and Construction Equipment Enter formulas into the green boxes below to create a model. Real Estate (Real Estate typically has a 40+ year useful life so that we will ignore replacement) Real Estate Stock- Real Estate Stock previous year plus Real Estate Additions current year (set to index of 1,000 in 1999) Real Estate Growth Rate - Annual Growth Rate of Real Estate (approximated by GNP growth) Real Estate Additions - Real Estate Stock previous year multiplied by Real Estate Growth Rate current year Change in Real Estate Additions - Real Estate Additions current year minus maximum of Real Estate Additions previous 20 years Construction Equipment (measured in equivalent units of Real Estate Additions) Construction Equipment Stock - Construction Equipment Stock previous year plus Construction Equipment Additions current year Construction Equipment Additions - maximum of Real Estate Change in Additions current year and zero (do not reduce stock if underutilized) Construction Equipment Replacement - As construction equipment has a 20 year useful life, Construction Equipment Replacement is equal to Construction Equipment Sales of 20 years ago Construction Equipment Sales - the sum of Construction Equipment Additions plus Construction Equipment Replacements The cells will turn red if the formula you enter in the cell is incorrect. Real Estate Construction Equipment Year Stock Growth Additions Change in Stock Additions Replacements Sales Sales Growth 1999 1,000 Rate Additions 2000 1.0 2001 1.0 2002 0.9 2003 0.9 2004 0.8 2005 2006 2007 2008 2009 2010 2011 2012 2013 2014 2015 2016 2017 2018 2019 2020E 2021E 2022E 2023E 2024E 2025E 2026E 2027E 2028E 2029E 2030E 2031E 2032E 2033E 2034E 2035E 2036E 2037E 2038E 2039E 2040E In the baseline scenario in which growth remains flat at 2% annually The Stock of Construction Equipment increases 'monotonically'. Amonotonically increasing function is one that increases as x does for all realx In other words, the function increases steadily without ever declining asx increases. DATA ANALYSIS Seasonality DATA Seasonality CASE Seasonality EXCEL Statistical Functions EXCEL Workspace A CASE Capital EquipYou are going to forecast the impact of different potential Amazon strategies on USPS' competitive business. The USPS does not disclose the details of its agreement with Amazon. Financial analysts often have to work with limited information. Below is a 'baseline' model assuming that: Revenues of the competitive business are currently $6.8 billion and grow at 11% annually Variable Costs related to the competitive business is $1.6 billion and grow at 11% annually. The competitive business currently loses $.8 billion on the competitive business based on the fact that USPS loses 12% on its overall revenues. The following values are calculated based on accounting relationships: Allocated Fixed Costs = Fully Absorbed Costs - Variable Costs Fully Absorbed Costs = Revenues - Profit Profit = Revenues - Fully Absorbed Cost Marginal Contribution = Revenues - Variable Costs The Marginal Contribution represents how much the companies profits would decline were the company to lose the business (assuming the fixed costs cannot be eliminated). 2019 2020 2021 2022 2023 2024 2025 2026 2027 2028 Revenues 6.8 7.5 8.4 9.3 10.3 11.5 12.7 14.1 15.7 17.2 Variable Costs 1.6 1.8 2.0 2.2 2.4 2.7 3.0 3.3 3.7 4.1 Allocated Fixed Costs 5.0 6.7 7.4 8.2 9.1 10.1 11.3 12.5 13.9 15.4 Fully Absorbed Costs 7.6 8.5 9.4 10.4 11.6 12.8 14.2 15.8 17.6 19.5 Profit 0.8 -0.9 -1.0 -1.1 -1.2 -1.4 -1.5 -1.7 -1.9 -2.2 Marginal Contribution 5.2 5.8 6.4 7.1 7.9 8.8 9.7 10.8 12.0 13.1 As you can see, the 'baseline' scenario results in the competitive business of USPS remaining unprofitable on a fully absorbed cost basis but generating significant marginal contribution. Assuming, $1.6 billion Variable Costs in 2019, enter the value (not a formula) of Marginal Contribution in 2028. While we know that the legally required minimum revenue of the competitive business is $1.6 billion, we do not know what Variable Costs are. Change the Variable Costs in the green cell above to $4 billion to perform a sensitivity analysis of this unknown value. Assuming, $4 billion Variable Costs in 2019, enter the value (not a formula) of Marginal Contribution in 2028 The economics of USPS is very sensitive to the assumption on Variable Costs. Return the 2019 Variable Costs above to $1.6 billion. We will expand the above model to isolate and forecast the size and profitability of USPS's services to Amazon. Let's 'guesstimate' that: DATA ANALYSIS Seasonality DATA Seasonality CASE Seasonality EXCEL Statistical Functions EXCEL Workspace CASE Capital Equip CASE USPS) 1 We will expand.the above model to isolate and forecast the size and profitability of USPS's services to Amazon. Let's 'guesstimate' that: ; Amazon currently represents 30% of USPS competitive revenues. Amazon is currently receiving a 25% discount resulting in USPS's variable cost per dollar of revenue being 33% greater (1/(1-25%)=1.33) than for other customers. USPS' fixed costs per dollar of revenues for Amazon are inflated by 33% assuming fixed costs are allocated based on volume not revenues. 7 Let's assume that the impact of USPS pricing strategy to Amazon will occur as a step change at the beginning of the next calendar year. Amazon 4 Revenues 1.7 1.9 21 23 26 29 3.2 35 39 43 ) Variable Costs 05 0.6 0.7 0.7 08 09 10 11 12 14 Allocated Fixed Costs 15 17 19 21 23 25 28 31 35 3.8 Fully Absorbed Costs 20 23 25 28 31 34 38 42 47 4 Profit (0.3) (0.4) (0.4) (0.5) (0.5) (0.6) (0.6) (0.7) (0.8) (0.9) Marginal Contribution 12 13 14 16 18 20 22 24 27 7 The results of the model are driven by entering values for the following two factors: The percent of the 30% of USPS's competitive business revenues that Amazon currently represents that USPS would lose if USPS retains its current pricing. B Percent of Revenues from Amazon Lost The additional discount that USPS would need to offer Amazon to retain the current share of Amazon's deliveries that USPS represents. | Additional Discount Provided to Amazon : Forecast the following two scenarios (Harvest and Defend) by applying the above model Enter the appropriate values in the two green cells immediately above. Harvest Strategy 4 In a'Harvest' strategy a company retains its pricing and sacrifices sales. ; Assume USPS will not increase its discount to Amazon but will ultimately lose 50% of it current share. Percent of Revenues from Amazon Lost =50%, Additional Discount Provided to Amazon = 0%. k In the green cells below enter the values (not a formula) of the Profit and Marginal Contribution based on this hypothesized scenario. 4 Profit Marginal Contribution Defend Strategy Y In a'Defend' strategy a company reduces its pricing and retains sales. Assume an incremental 30% discount will avoid any additional loss of deliveries to Amazon internal operations. Harvest Strategy In a 'Harvest' strategy a company retains its pricing and sacrifices sales. Assume USPS will not increase its discount to Amazon but will ultimately lose 50% of it current share. Percent of Revenues from Amazon Lost = 50%, Additional Discount Provided to Amazon = 0%. In the green cells below enter the values (not a formula) of the Profit and Marginal Contribution based on this hypothesized scenario. Profit Marginal Contribution Defend Strategy In a 'Defend' strategy a company reduces its pricing and retains sales. Assume an incremental 30% discount will avoid any additional loss of deliveries to Amazon internal operations. Percent of Revenues from Amazon Lost = 0%, Additional Discount Provided to Amazon = 30%. In the green cells below enter the values (not a formula) of the Profit and Marginal Contribution based on this hypothesized scenario. Profit Marginal Contribution If you were the Postmaster General which strategy would you select
