https://docs.google.com/spreadsheets/d/1wqULp1ELg_2uvVu5w_Djwmw7kPTCijGAqGQjvhCSHJM/edit
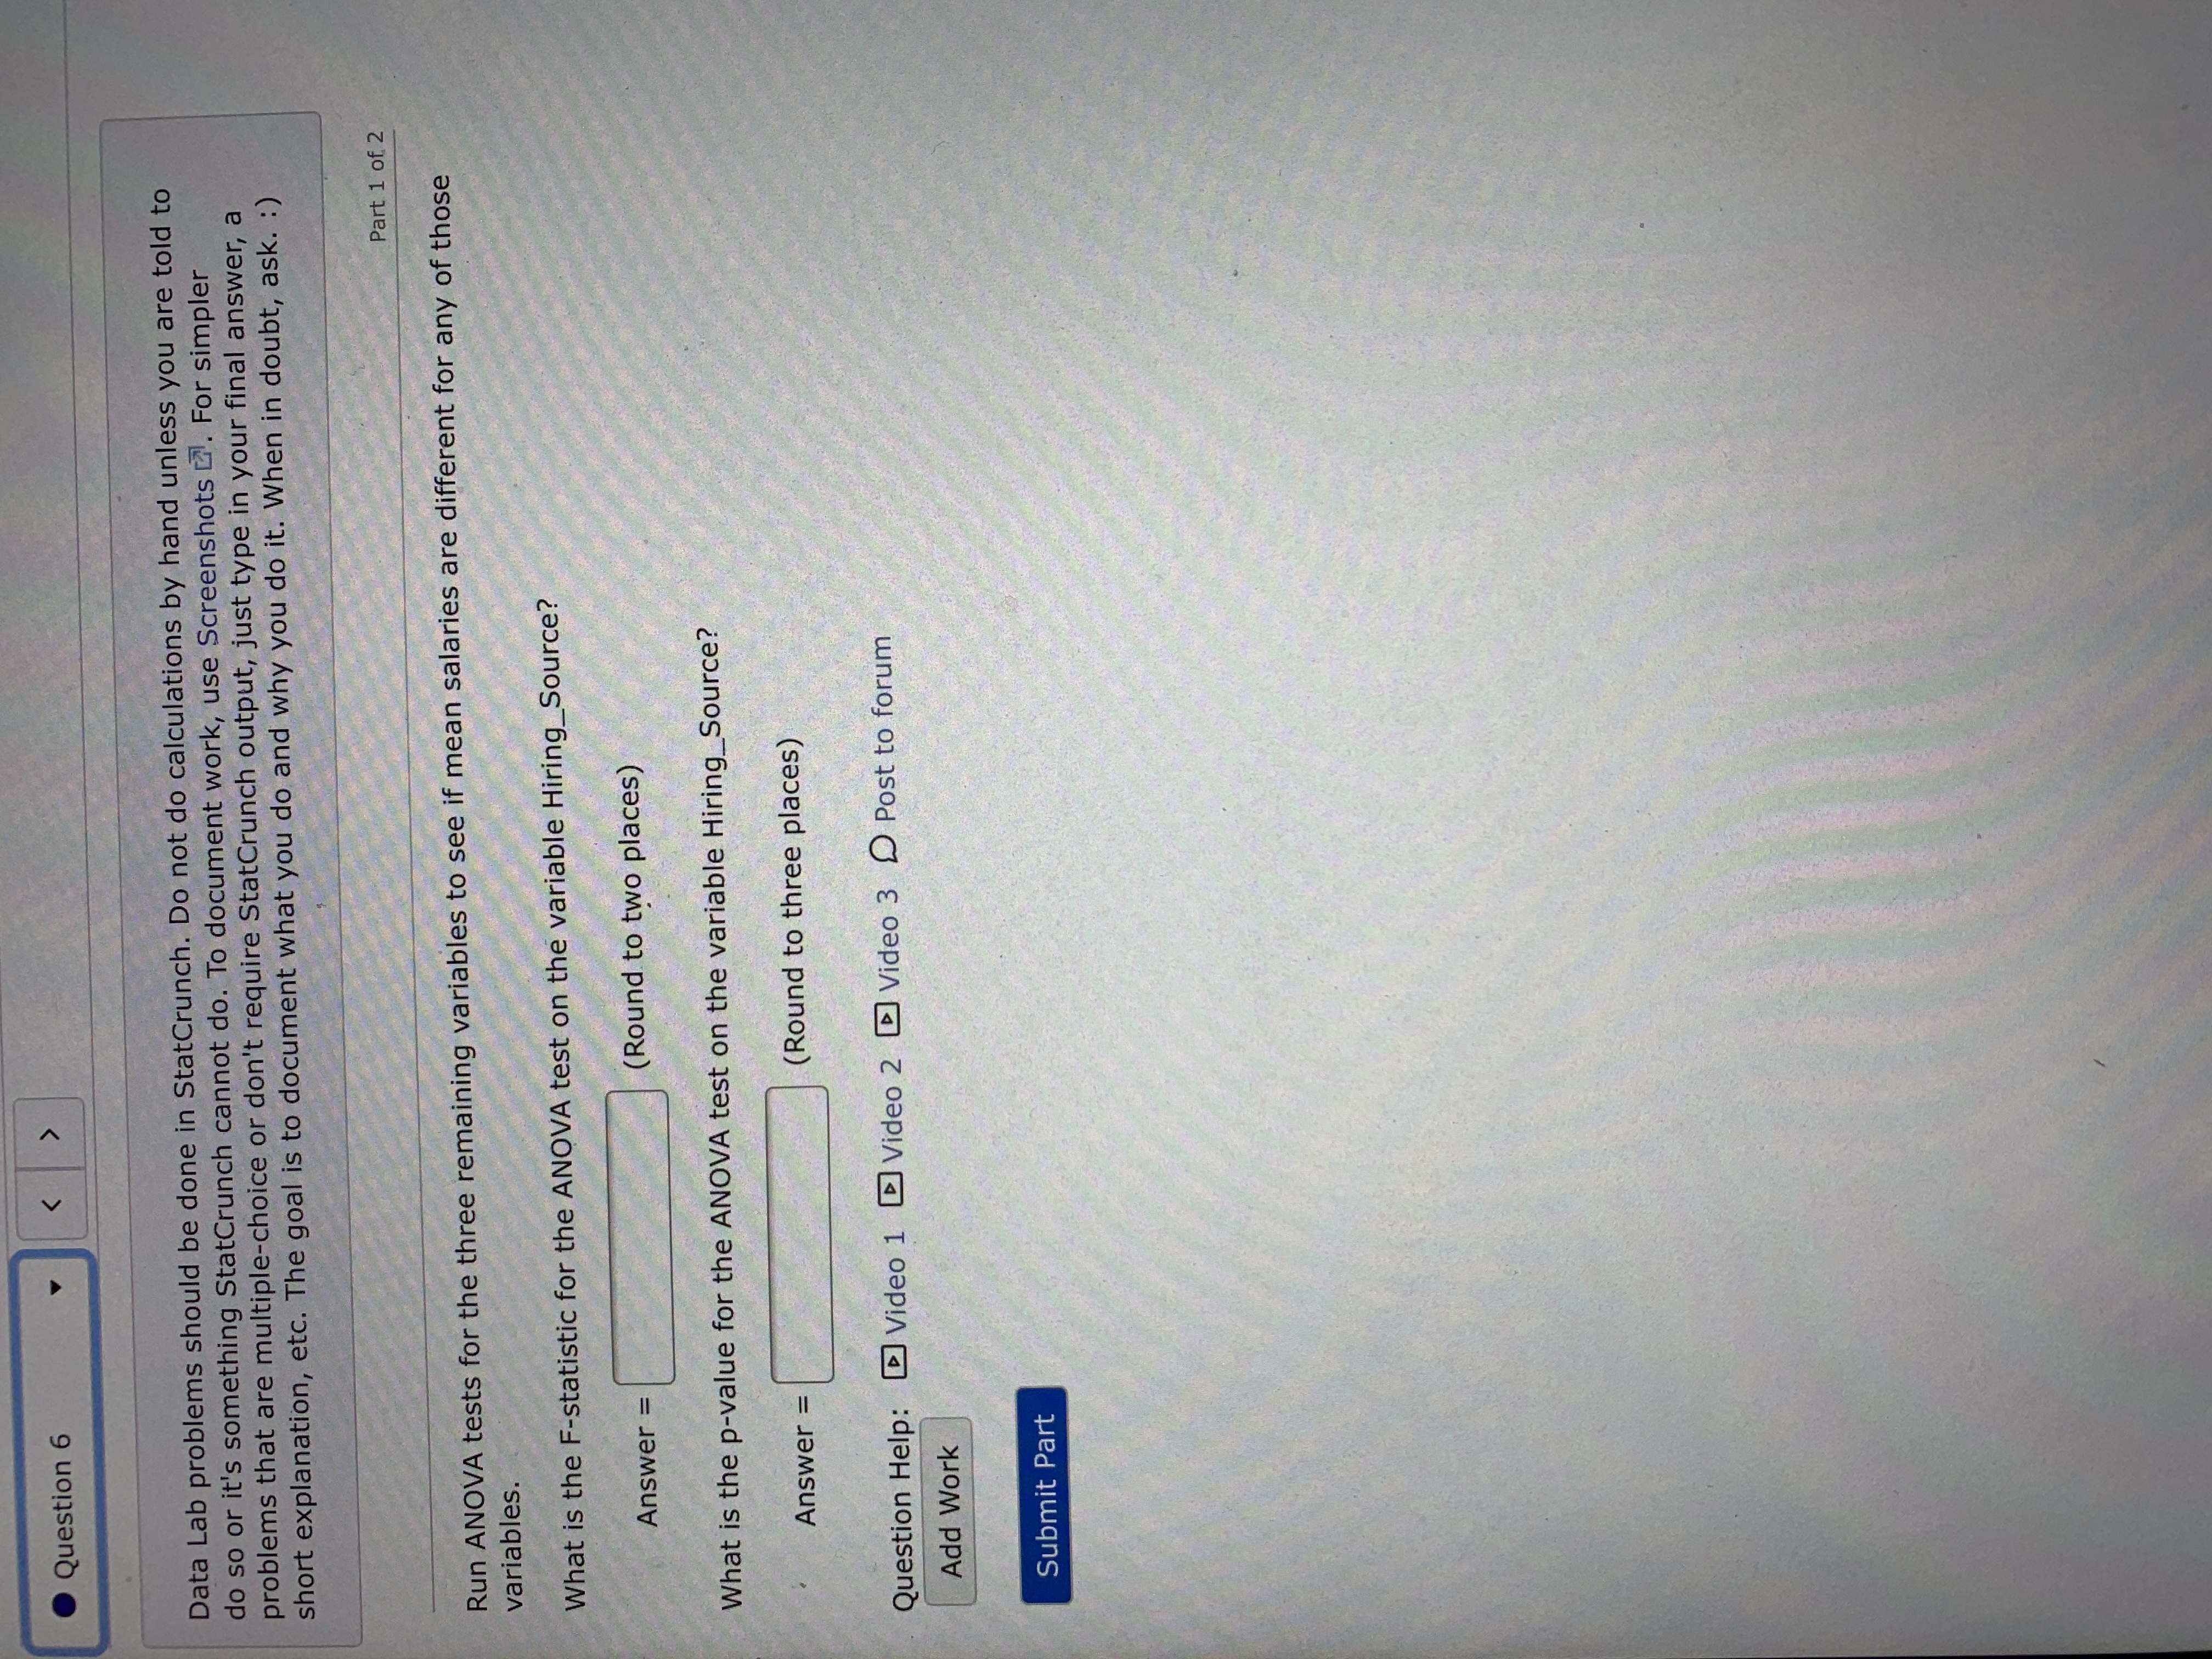
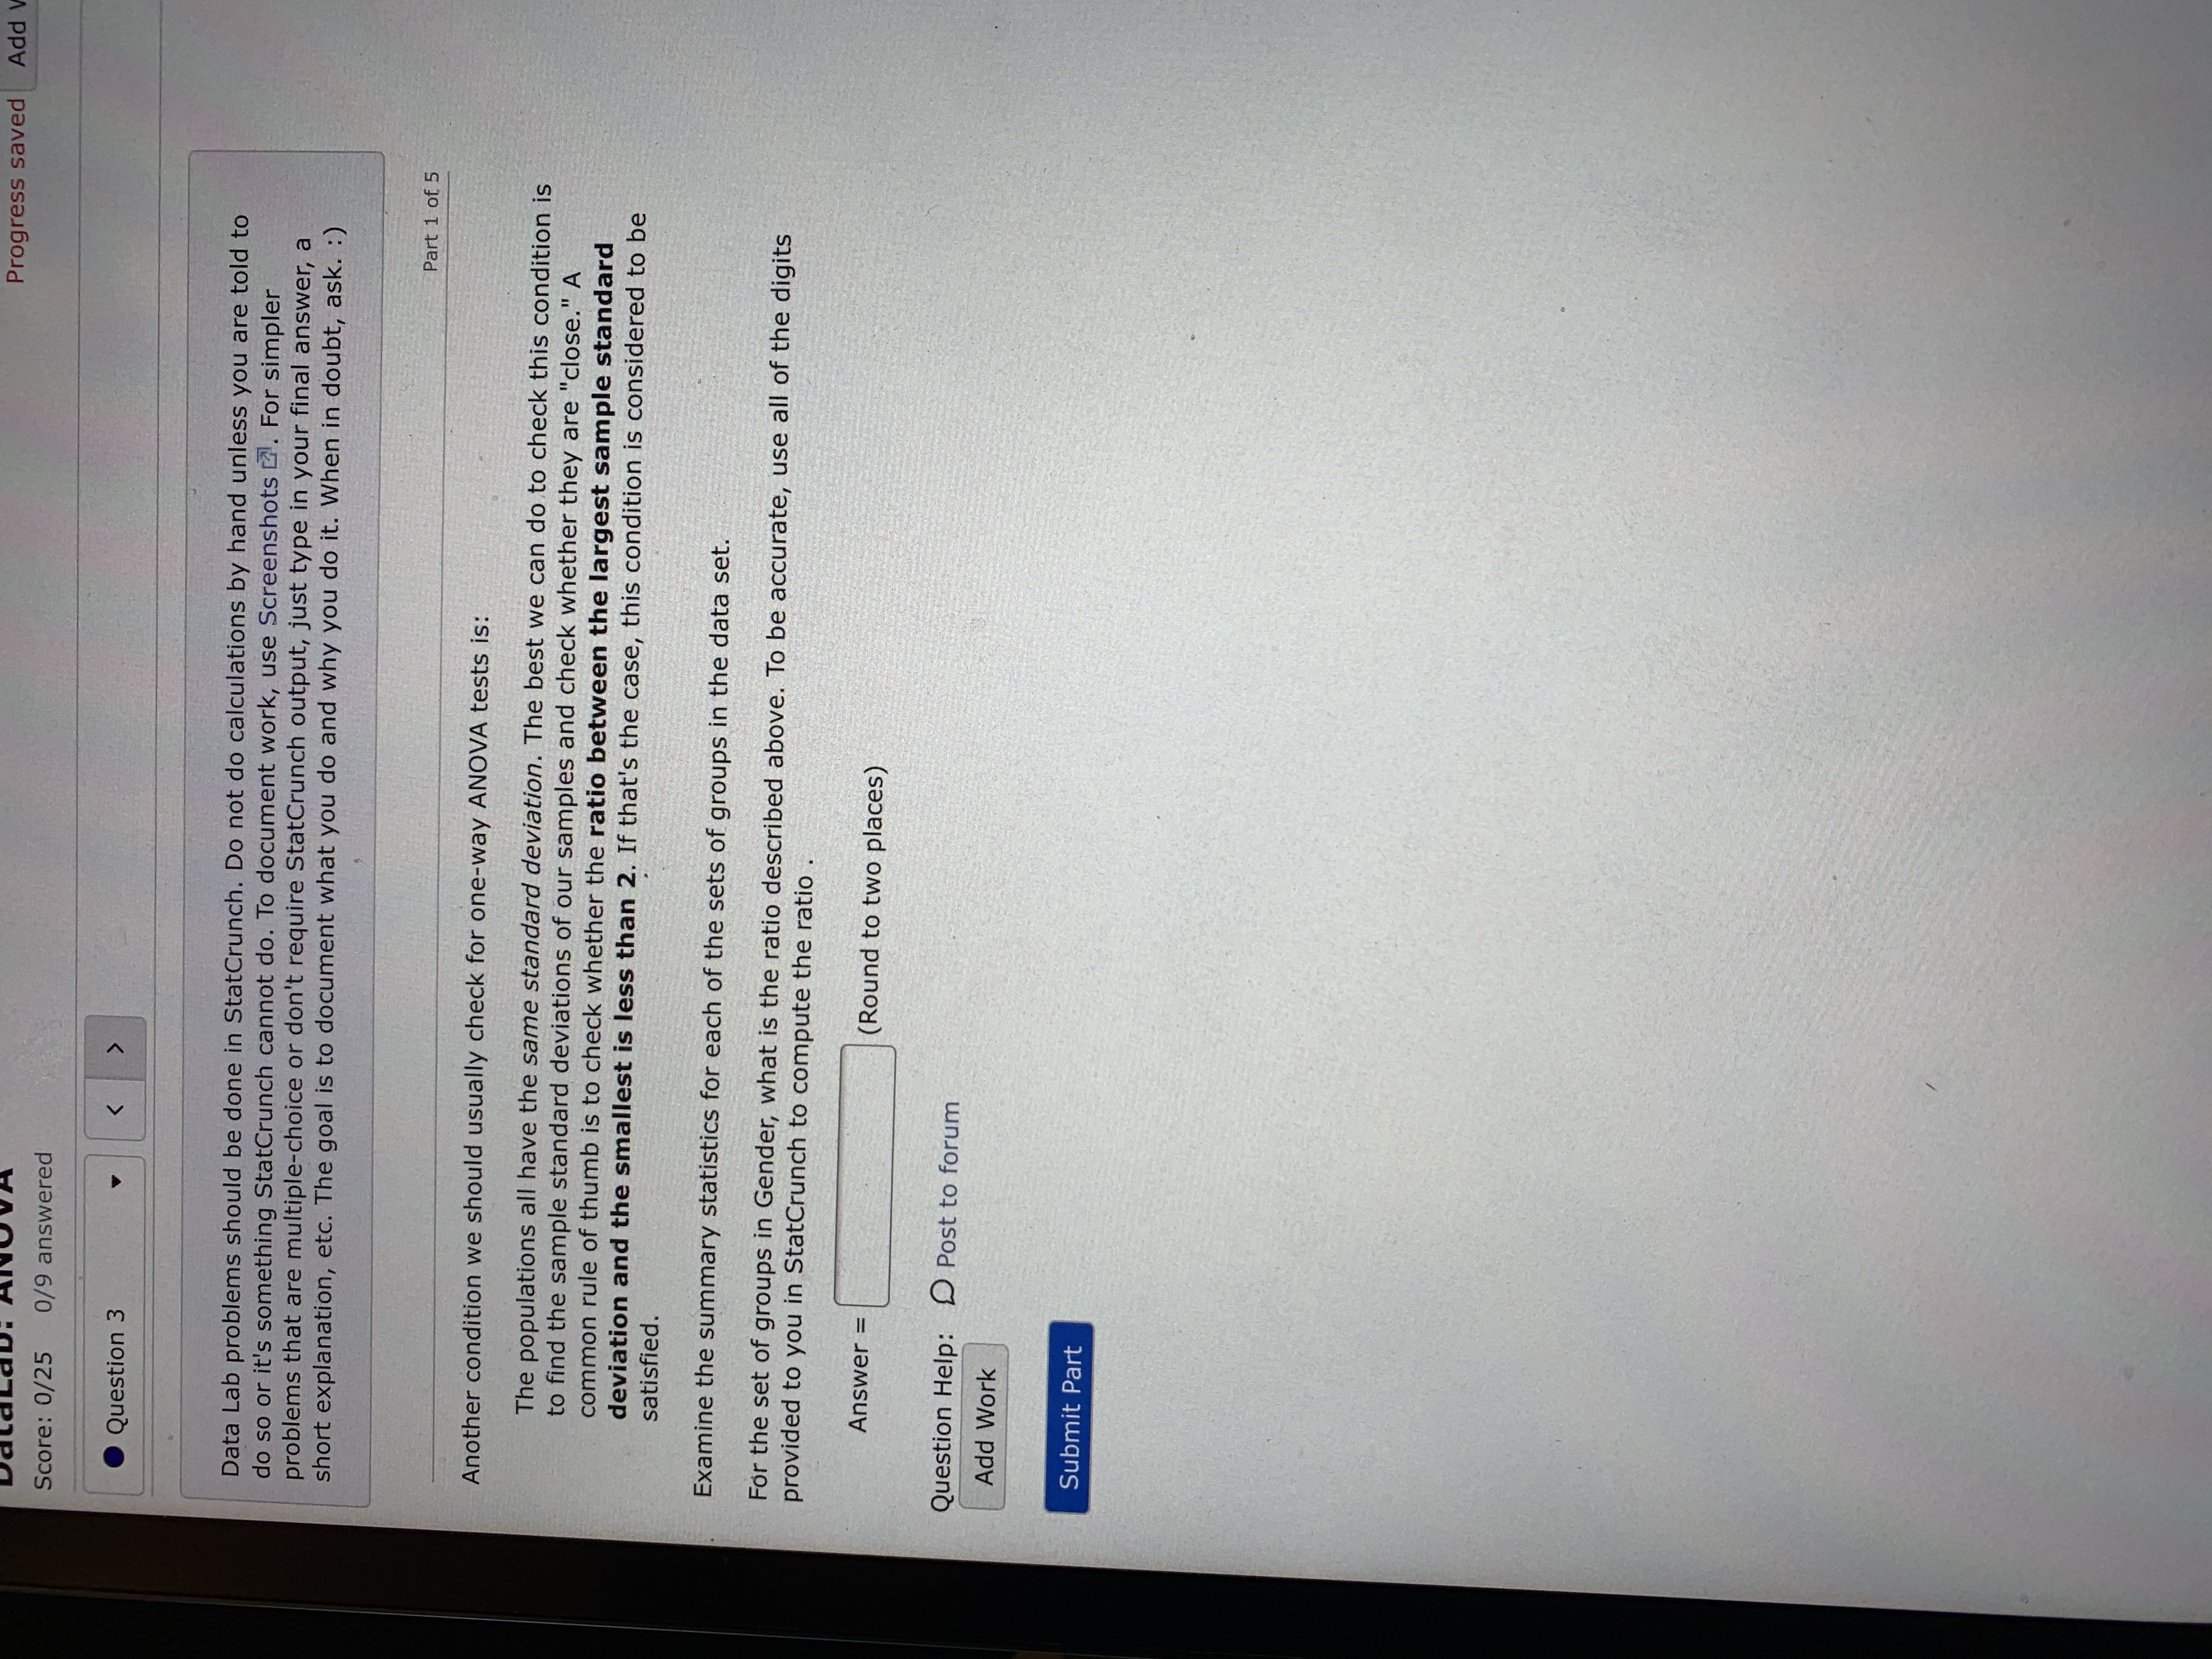
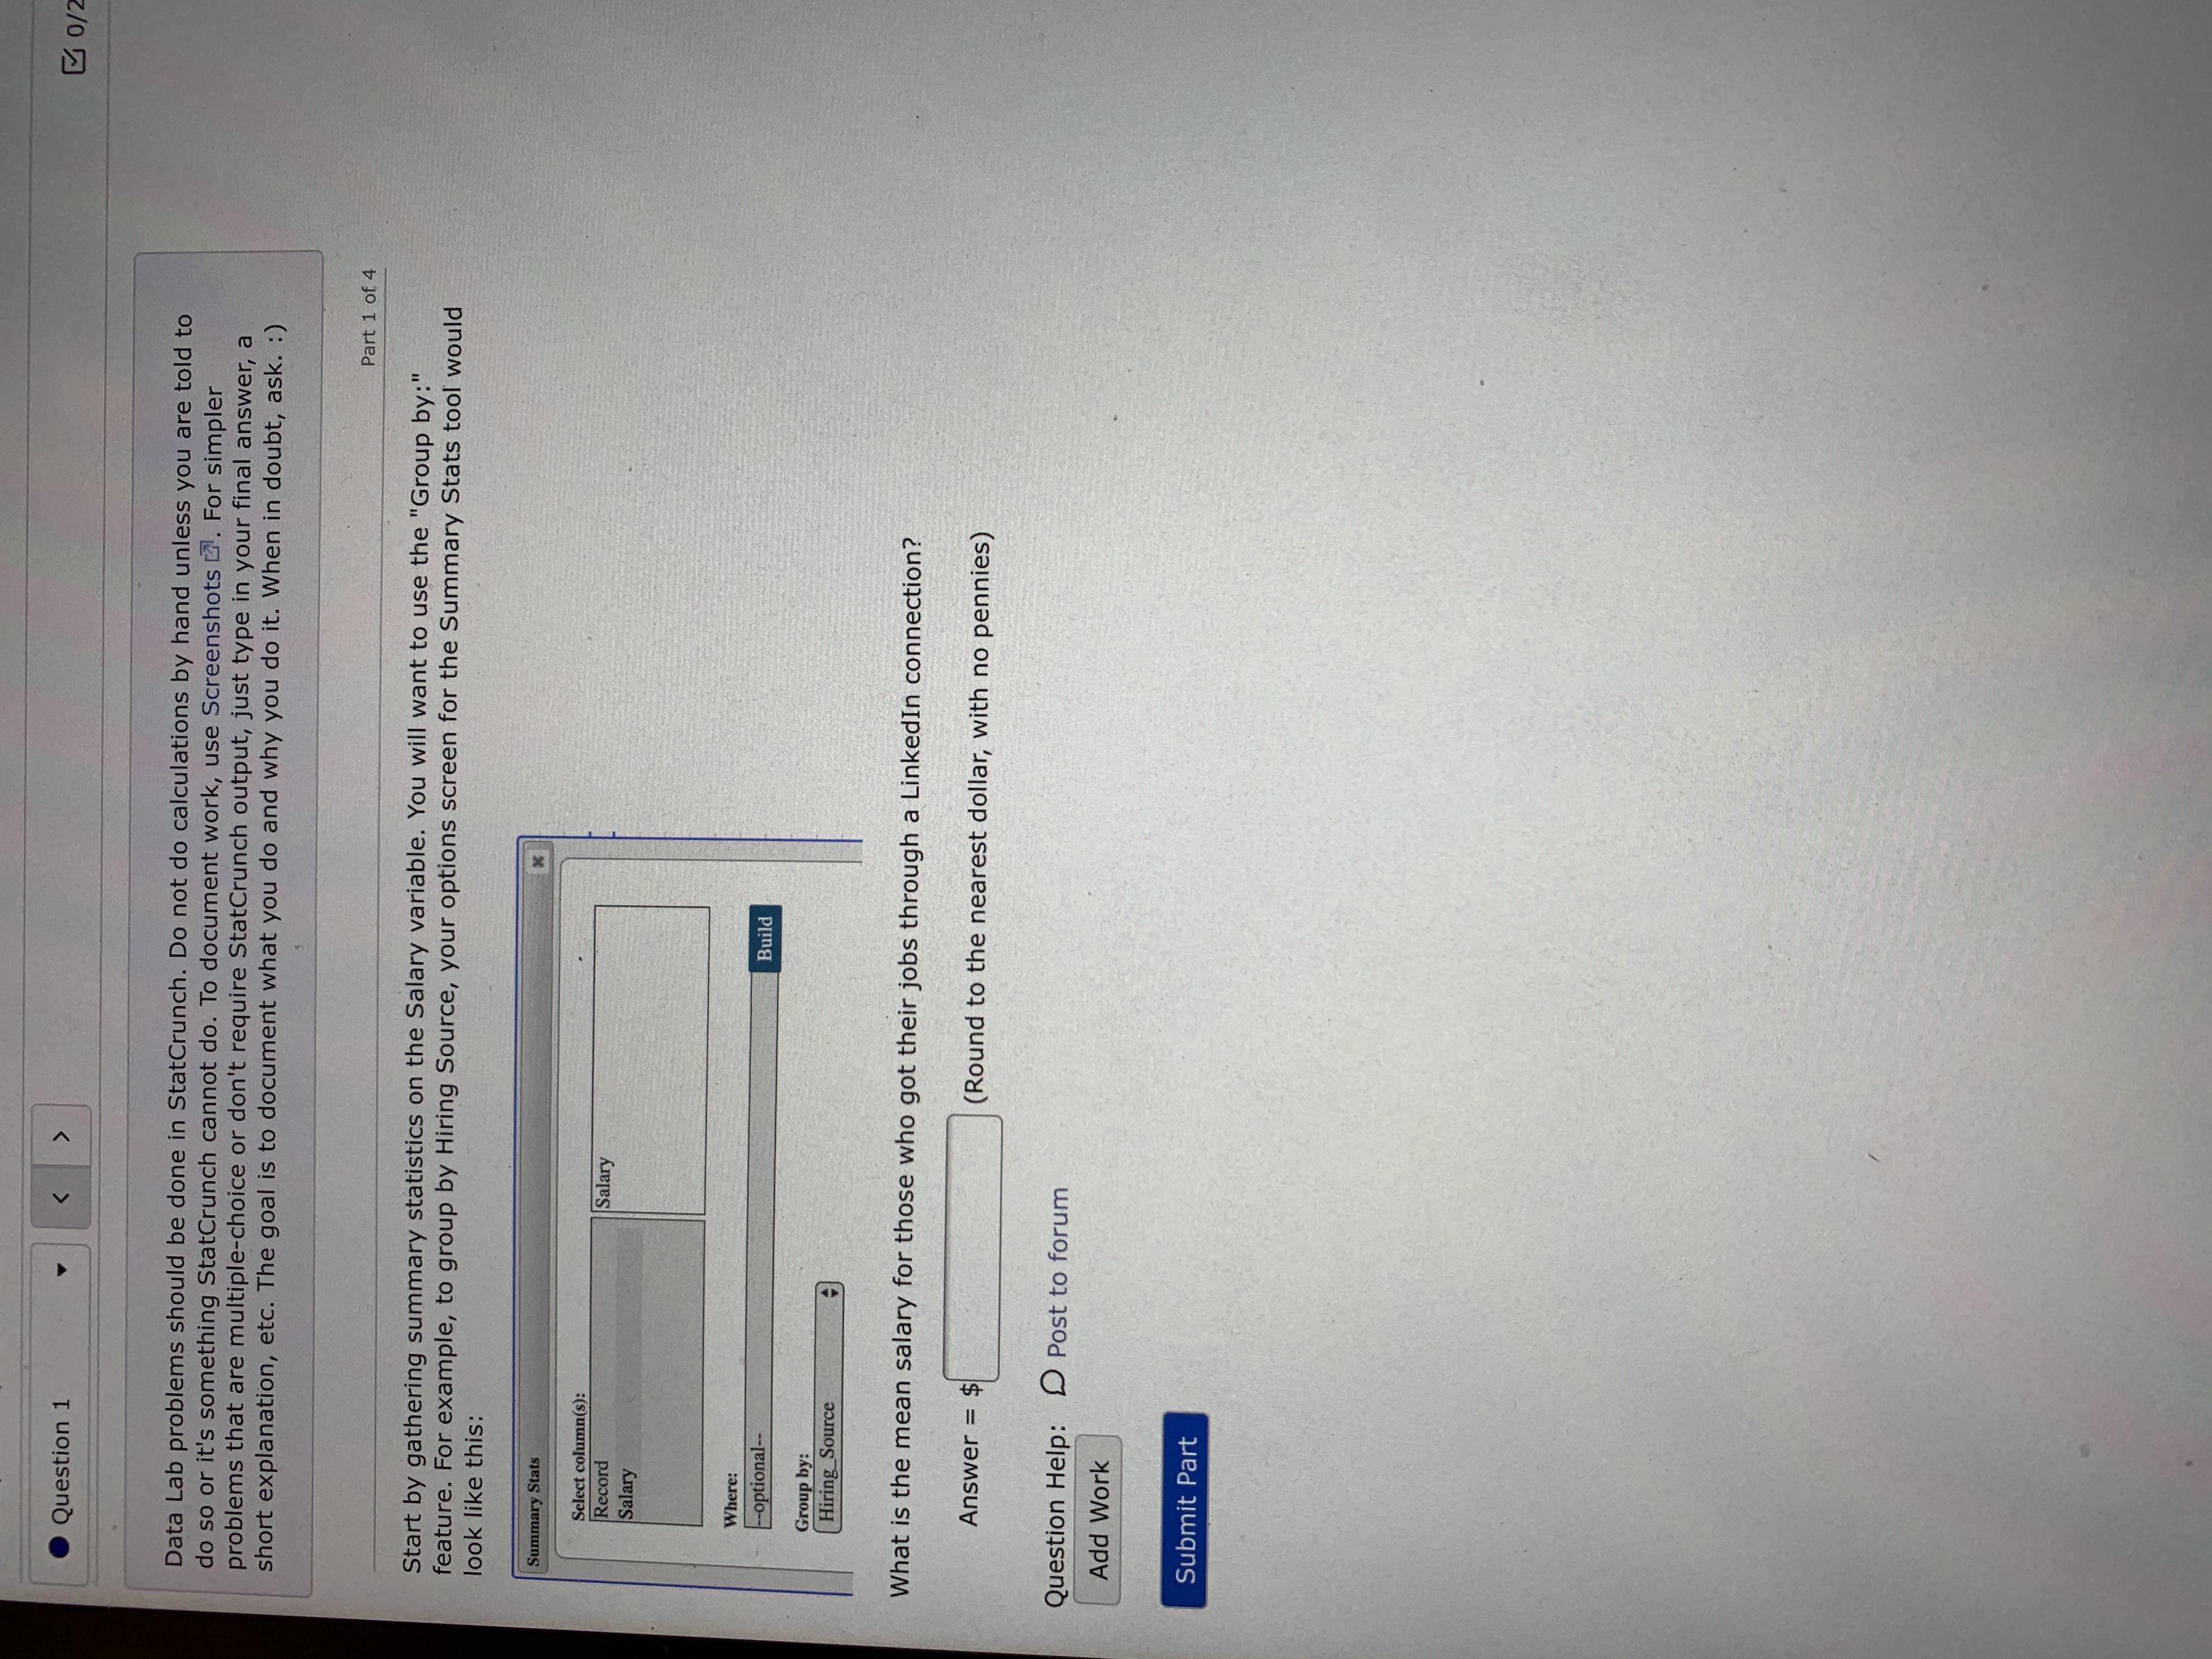
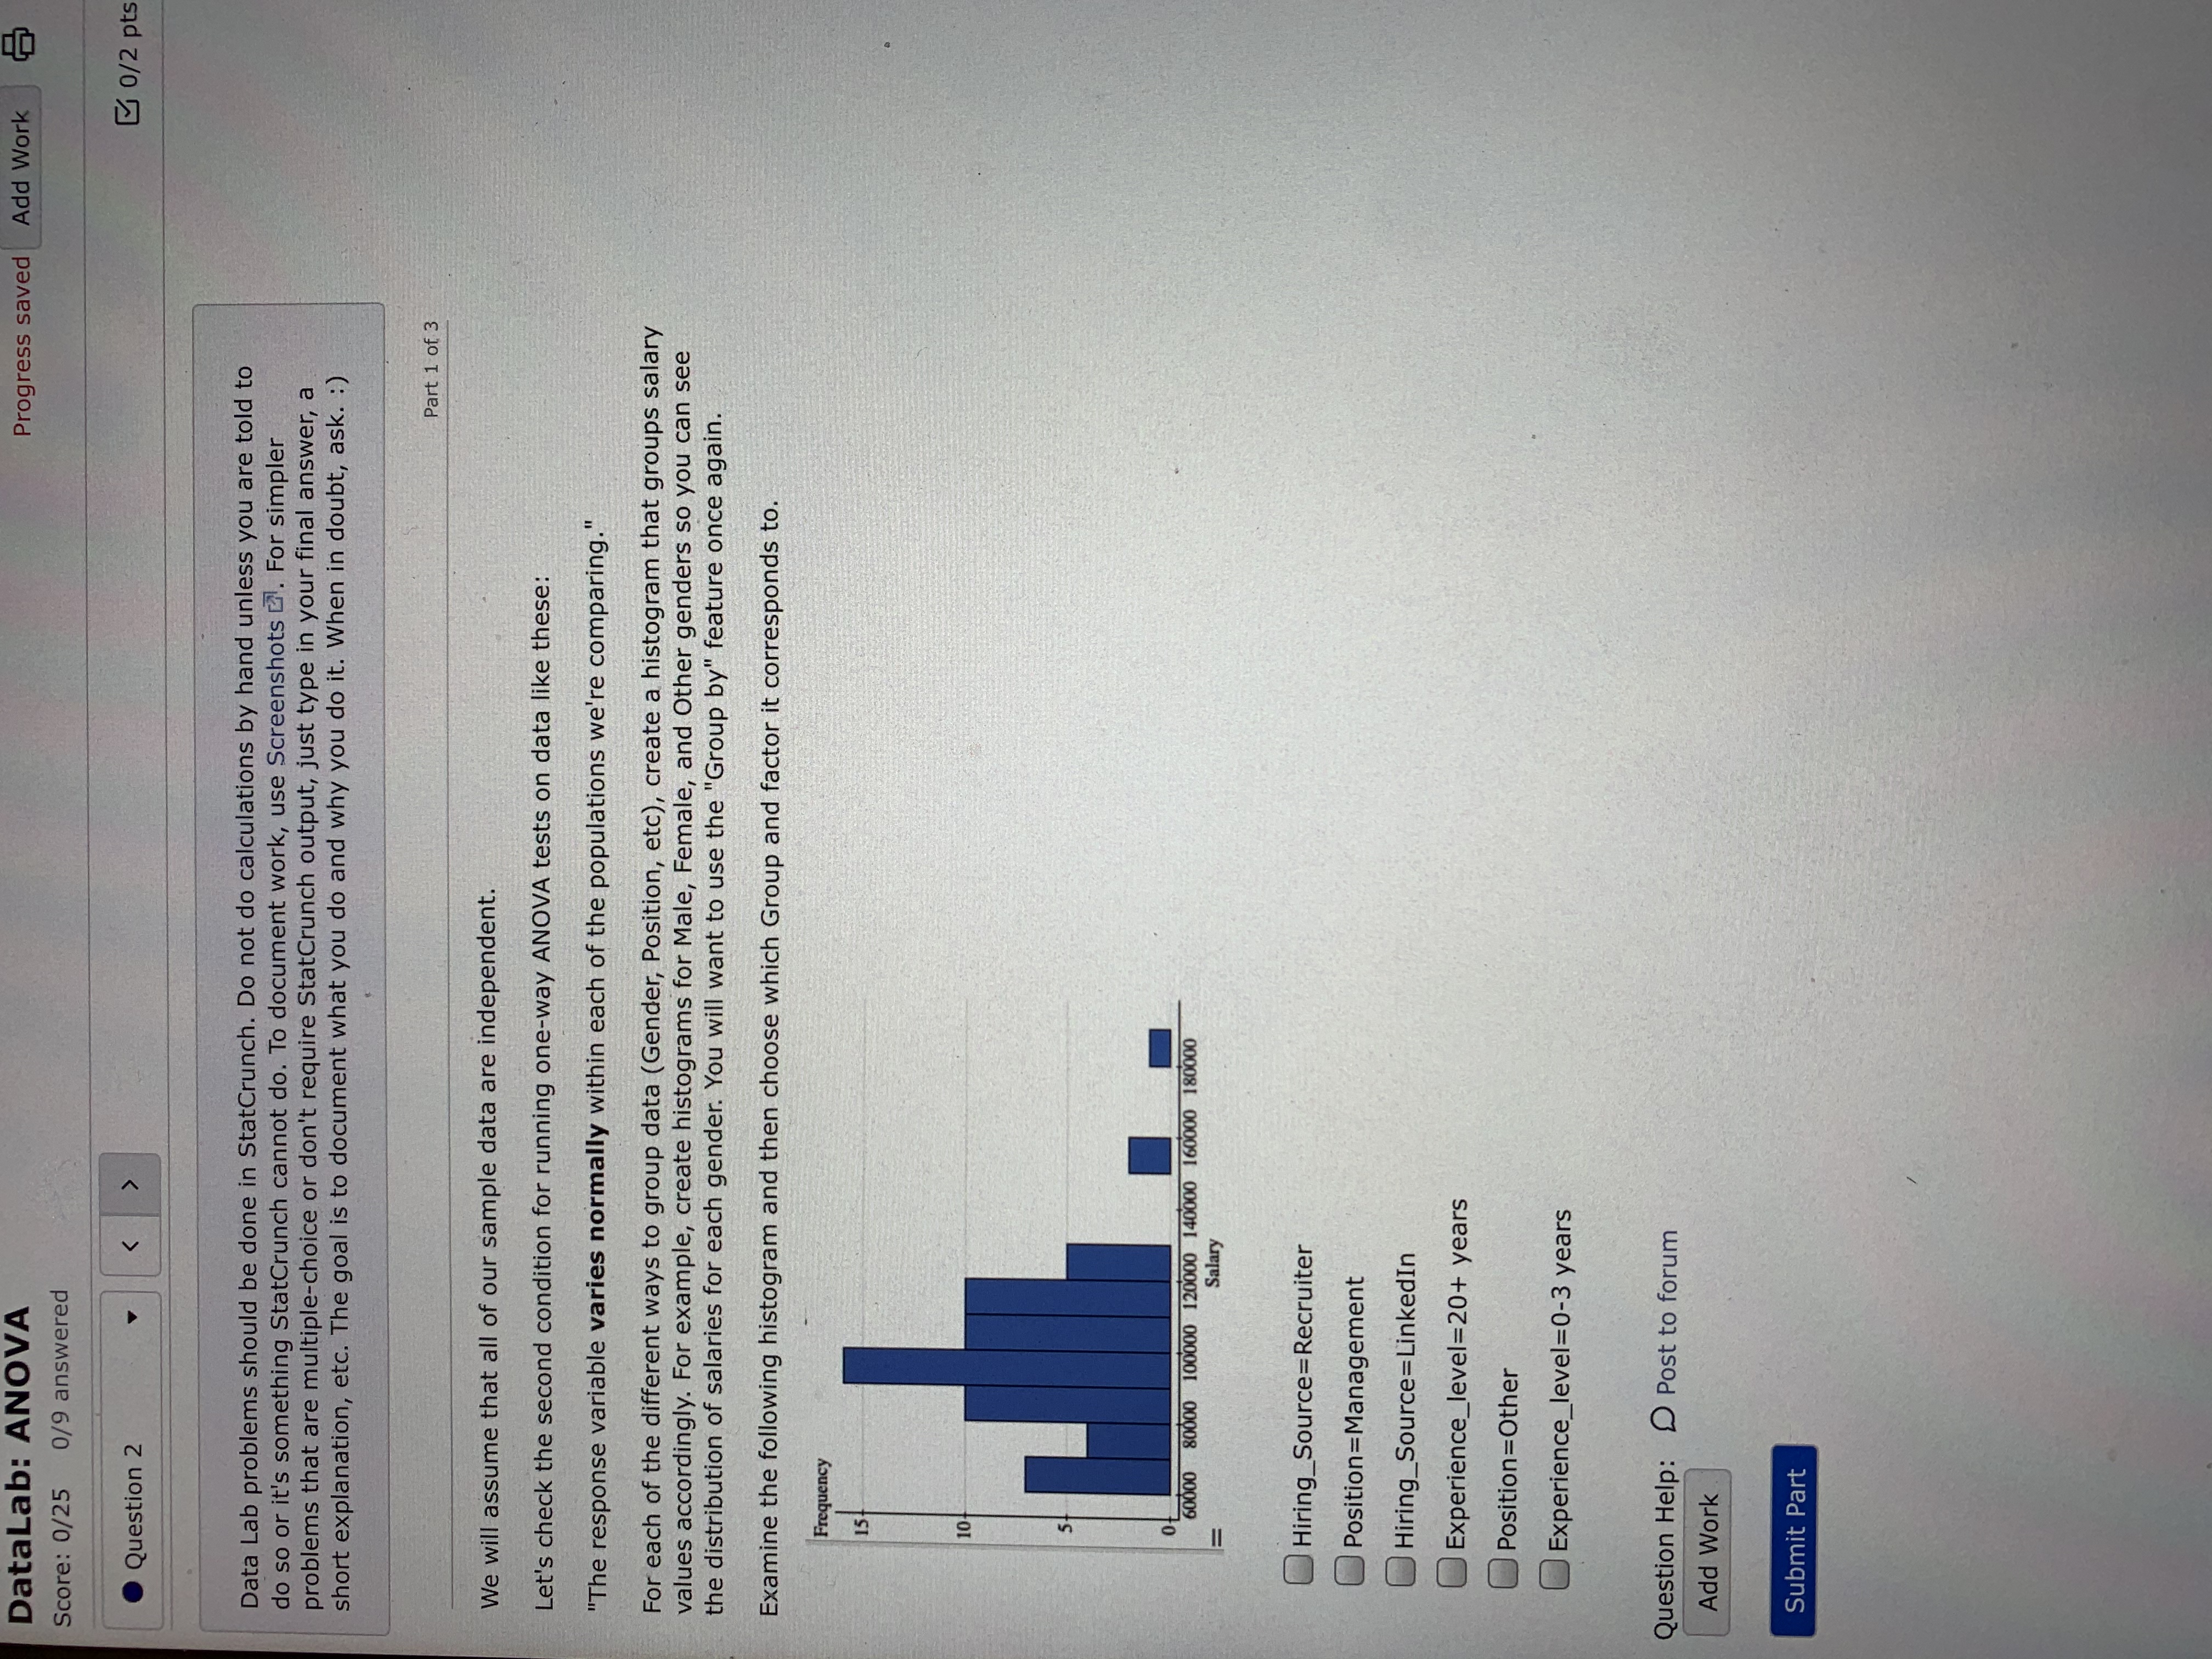
. Question 6 Data Lab problems should be done in StatCrunch. Do not do calculations by hand unless you are told to do so or it's something StatCrunch cannot do. To document work, use Screenshots . For simpler problems that are multiple-choice or don't require StatCrunch output, just type in your final answer, a short explanation, etc. The goal is to document what you do and why you do it. When in doubt, ask. :) Part 1 of 2 Run ANOVA tests for the three remaining variables to see if mean salaries are different for any of those variables. What is the F-statistic for the ANOVA test on the variable Hiring_Source? Answer = (Round to two places) What is the p-value for the ANOVA test on the variable Hiring_Source? Answer = (Round to three places) Question Help: Video 1 Video 2 ) Video 3 D Post to forum Add Work Submit PartProgress saved Add Score: 0/25 0/9 answered . Question 3 Data Lab problems should be done in StatCrunch. Do not do calculations by hand unless you are told to do so or it's something StatCrunch cannot do. To document work, use Screenshots . For simpler problems that are multiple-choice or don't require StatCrunch output, just type in your final answer, a short explanation, etc. The goal is to document what you do and why you do it. When in doubt, ask. :) Part 1 of 5 Another condition we should usually check for one-way ANOVA tests is: The populations all have the same standard deviation. The best we can do to check this condition is to find the sample standard deviations of our samples and check whether they are "close." A common rule of thumb is to check whether the ratio between the largest sample standard deviation and the smallest is less than 2. If that's the case, this condition is considered to be satisfied. Examine the summary statistics for each of the sets of groups in the data set. For the set of groups in Gender, what is the ratio described above. To be accurate, use all of the digits provided to you in StatCrunch to compute the ratio . Answer = (Round to two places) Question Help: Post to forum Add Work Submit Part. Question 1 Data Lab problems should be done in StatCrunch. Do not do calculations by hand unless you are told to do so or it's something StatCrunch cannot do. To document work, use Screenshots . For simpler problems that are multiple-choice or don't require StatCrunch output, just type in your final answer, a short explanation, etc. The goal is to document what you do and why you do it. When in doubt, ask. :) Part 1 of 4 Start by gathering summary statistics on the Salary variable. You will want to use the "Group by:" feature. For example, to group by Hiring Source, your options screen for the Summary Stats tool would look like this: Summary Stats Select column(s): Record Salary Salary Where: --optional-- Build Group by: Hiring_Source What is the mean salary for those who got their jobs through a LinkedIn connection? Answer = $ (Round to the nearest dollar, with no pennies) Question Help: D Post to forum Add Work Submit PartAdd Work Score: 1.8/25 0/9 answered Question 7
