https://twu.instructur Carbon dioxide is produced by burning fossil fuels such as oil and natural gas, and has been connected to global warming. The following output
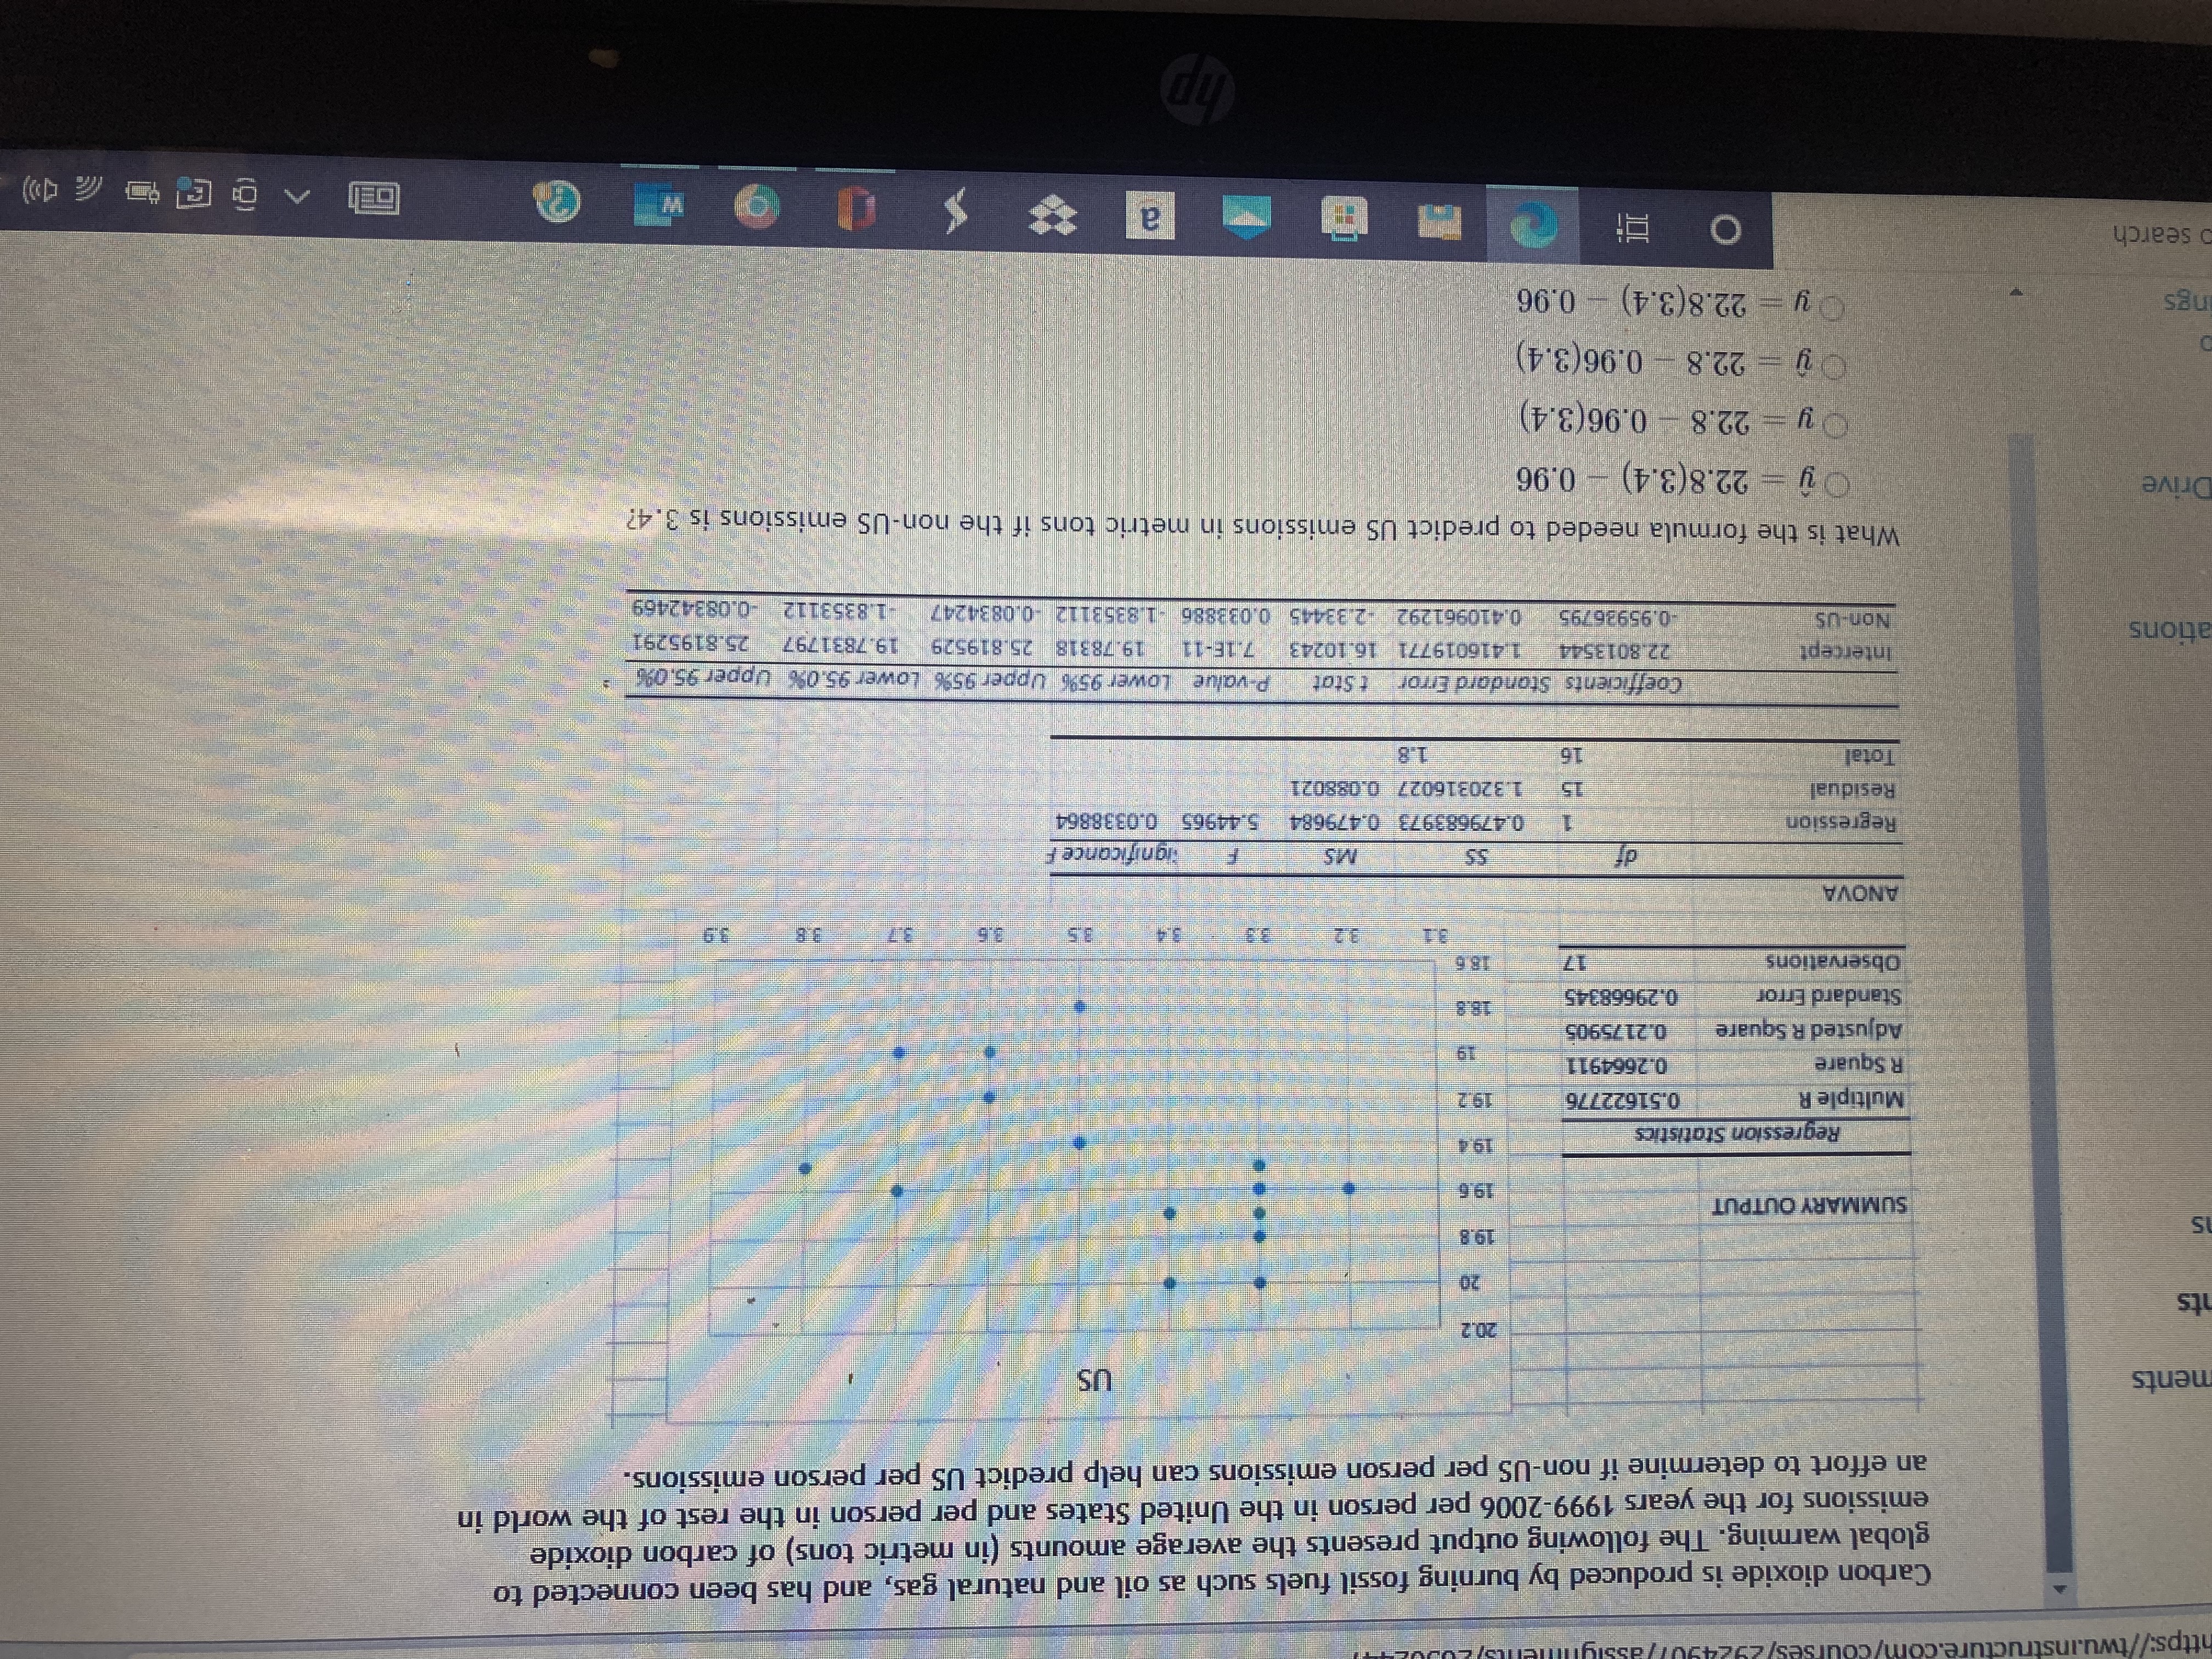
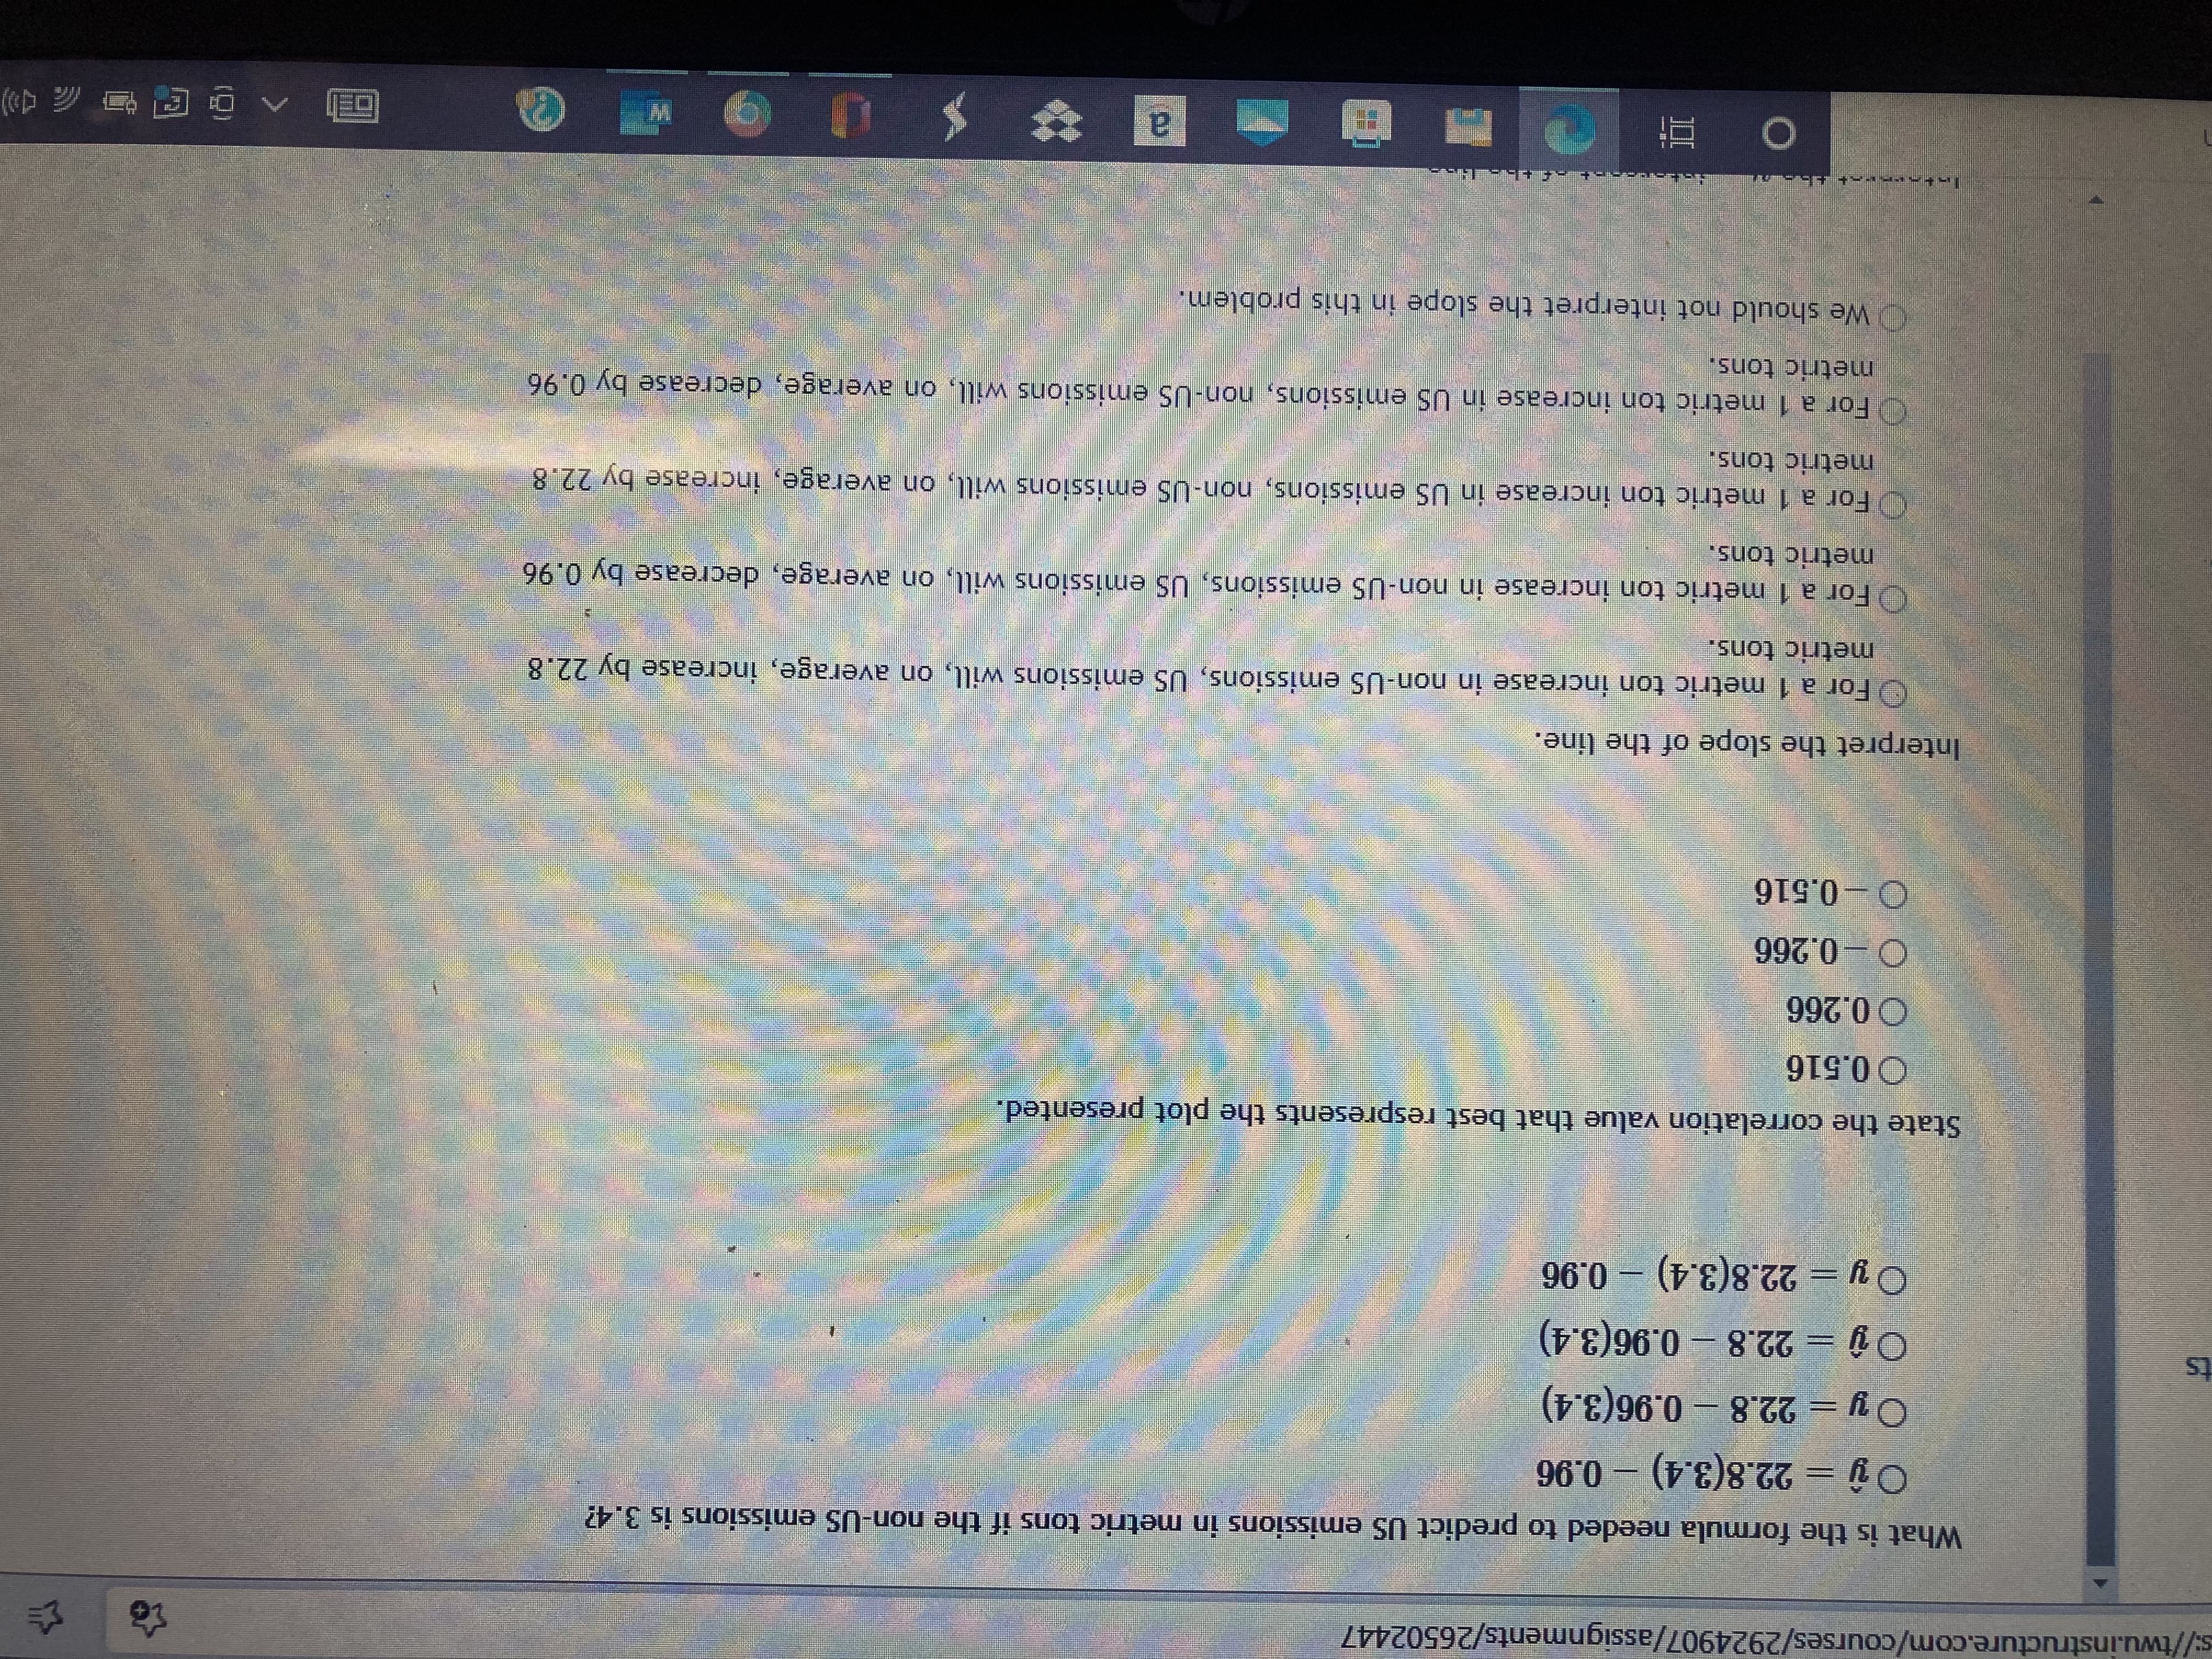
https://twu.instructur Carbon dioxide is produced by burning fossil fuels such as oil and natural gas, and has been connected to global warming. The following output presents the average amounts (in metric tons) of carbon dioxide emissions for the years 1999-2006 per person in the United States and per person in the rest of the world in an effort to determine if non-US per person emissions can help predict US per person emissions. ments 20.2 its 20 19.8 SUMMARY OUTPUT 19.6 Regression Statistics 19.4 Multiple R 0.51622776 19.2 R Square 0.2664911 Adjusted R Square 0.2175905 Standard Error 0.29668345 Observations 17 186 ANOVA of SS MS significance F Regression 1 0.479683973 0.479684 5.44965 0.0338864 Residual 5 1.320316027 0.088021 Total 16 1.8 Coefficients Standard Error t Stat P-value Lower 95%% Upper 95%% Lower 95.0% Upper 95.0%% Intercept 22.8013544 1.416019771 16.10243 7.15-11 19.78318 25.819529 19.7831797 25.8195291 ations Non-US -0.95936795 0.410961292 -2.32445 0.032886 -18353112 0.0834247 -1.8353112 -0.08342469 What is the formula needed to predict US emissions in metric tons if the non-US emissions is 3.4? Drive Oy - 22.8(3.4) - 0.96 y - 22.8 - 0.96(3.4) Oy - 22.8 - 0.96(3.4) ngs Oy = 22.8(3.4) - 0.96 search O a W hp://twu.instructure.com/courses/2924907/assignments/26502447 What is the formula needed to predict US emissions in metric tons if the non-US emissions is 3.4? Oy - 22.8(3.4) - 0.96 Oy = 22.8 - 0.96(3.4) Oy - 22.8 - 0.96(3.4) Oy - 22.8(3.4) - 0.96 State the correlation value that best respresents the plot presented. O 0.516 0.266 O-0.266 O -0.516 Interpret the slope of the line. For a 1 metric ton increase in non-US emissions, US emissions will, on average, increase by 22.8 metric tons. For a 1 metric ton increase in non-US emissions, US emissions will, on average, decrease by 0.96 metric tons. For a 1 metric ton increase in US emissions, non-US emissions will, on average, increase by 22.8 metric tons. For a 1 metric ton increase in US emissions, non-US emissions will, on average, decrease by 0.96 metric tons. We should not interpret the slope in this problem. O a Wre.com/courses/292490//assignments/265024 Interpret the slope of the line. O For a 1 metric ton increase in non-US emissions, US emissions will, on average, increase by 22.8 metric tons. O For a 1 metric ton increase in non-US emissions, US emissions will, on average, decrease by 0.96 metric tons. O For a 1 metric ton increase in US emissions, non-US emissions will, on average, increase by 22.8 metric tons. For a 1 metric ton increase in US emissions, non-US emissions will, on average, decrease by 0.96 metric tons. We should not interpret the slope in this problem. Interpret the y - intercept of the line. On average, when a - 0, non-US emissions are 22.8 metric tons. On average, when a - 0, US emissions are - 0.90 metric tons. On average, when a - 0, US emissions are 22.8 metric tons On average, when T - 0, non-US emissions are - 0.96 metric tons. We should not interpret the 7/ - intercept in this problem. We should interpret the y intercept, but none above
Step by Step Solution
There are 3 Steps involved in it
Step: 1
Get Instant Access to Expert-Tailored Solutions
See step-by-step solutions with expert insights and AI powered tools for academic success
Step: 2
Step: 3
Ace Your Homework with AI
Get the answers you need in no time with our AI-driven, step-by-step assistance