Question
https://www.mathworks.com/help/signal/ug/remove-the-60-hz-hum-from-a-signal.html load openloop60hertz, openLoop = openLoopVoltage; Fs = 1000; t = (0:length(openLoop)-1)/Fs; plot(t,openLoop) ylabel('Voltage (V)') xlabel('Time (s)') title('Open-Loop Voltage with 60 Hz Noise') grid d
https://www.mathworks.com/help/signal/ug/remove-the-60-hz-hum-from-a-signal.html
load openloop60hertz, openLoop = openLoopVoltage;
Fs = 1000;
t = (0:length(openLoop)-1)/Fs;
plot(t,openLoop)
ylabel('Voltage (V)')
xlabel('Time (s)')
title('Open-Loop Voltage with 60 Hz Noise')
grid
d = designfilt('bandstopiir','FilterOrder',2, ...
'HalfPowerFrequency1',59,'HalfPowerFrequency2',61, ...
'DesignMethod','butter','SampleRate',Fs);
fvtool(d,'Fs',Fs)
buttLoop = filtfilt(d,openLoop);
plot(t,openLoop,t,buttLoop)
ylabel('Voltage (V)')
xlabel('Time (s)')
title('Open-Loop Voltage')
legend('Unfiltered','Filtered')
grid
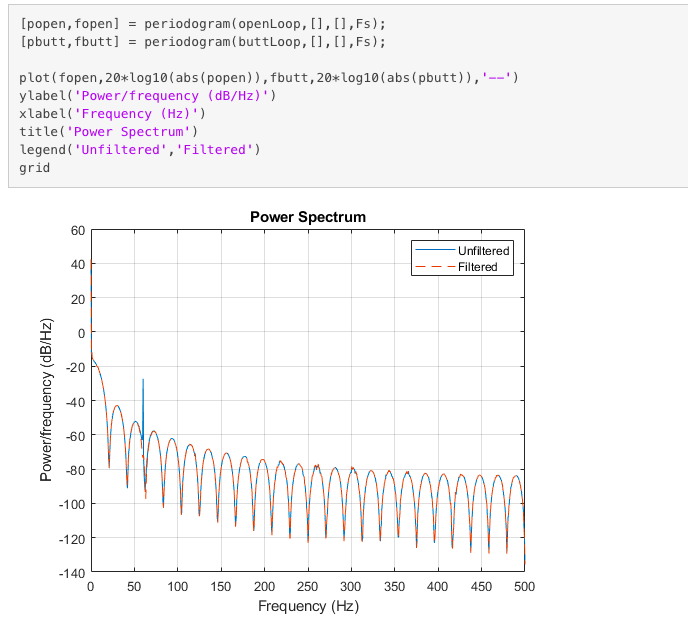
[popen,fopen] = periodogram(openLoop,[],[],Fs);
[pbutt,fbutt] = periodogram(buttLoop,[],[],Fs);
plot(fopen,20*log10(abs(popen)),fbutt,20*log10(abs(pbutt)),'--')
ylabel('Power/frequency (dB/Hz)')
xlabel('Frequency (Hz)')
title('Power Spectrum')
legend('Unfiltered','Filtered')
grid

Plot the power spectrum of the example, but do so with the range reduced to: 0-20 Hz. provide the code and graph
[popen, fopen] 0 = periodogram ( openLoop,[],[],Fs); perioogrm(buttLoo, [, [],F); 0 2 butt,fbutt] plot (fopen, 20xlog10 (abs (popen)),fbutt,20*log10 (abs (pbutt)),"-') ylabel('Power/frequency (dB/Hz)') xlabel( 'Frequency (Hz) title( 'Power Spectrum) legend 'Unfiltered, 'Filtered') grid Power Spectrum _Unfiltered _ _ -Filtered 40 -60 80 -100 -120 -140 0 50 100 150 200 250 300 350 400 450 500 Frequency (Hz) [popen, fopen] 0 = periodogram ( openLoop,[],[],Fs); perioogrm(buttLoo, [, [],F); 0 2 butt,fbutt] plot (fopen, 20xlog10 (abs (popen)),fbutt,20*log10 (abs (pbutt)),"-') ylabel('Power/frequency (dB/Hz)') xlabel( 'Frequency (Hz) title( 'Power Spectrum) legend 'Unfiltered, 'Filtered') grid Power Spectrum _Unfiltered _ _ -Filtered 40 -60 80 -100 -120 -140 0 50 100 150 200 250 300 350 400 450 500 Frequency (Hz)Step by Step Solution
There are 3 Steps involved in it
Step: 1

Get Instant Access to Expert-Tailored Solutions
See step-by-step solutions with expert insights and AI powered tools for academic success
Step: 2

Step: 3

Ace Your Homework with AI
Get the answers you need in no time with our AI-driven, step-by-step assistance
Get Started


