Hypothesis testing
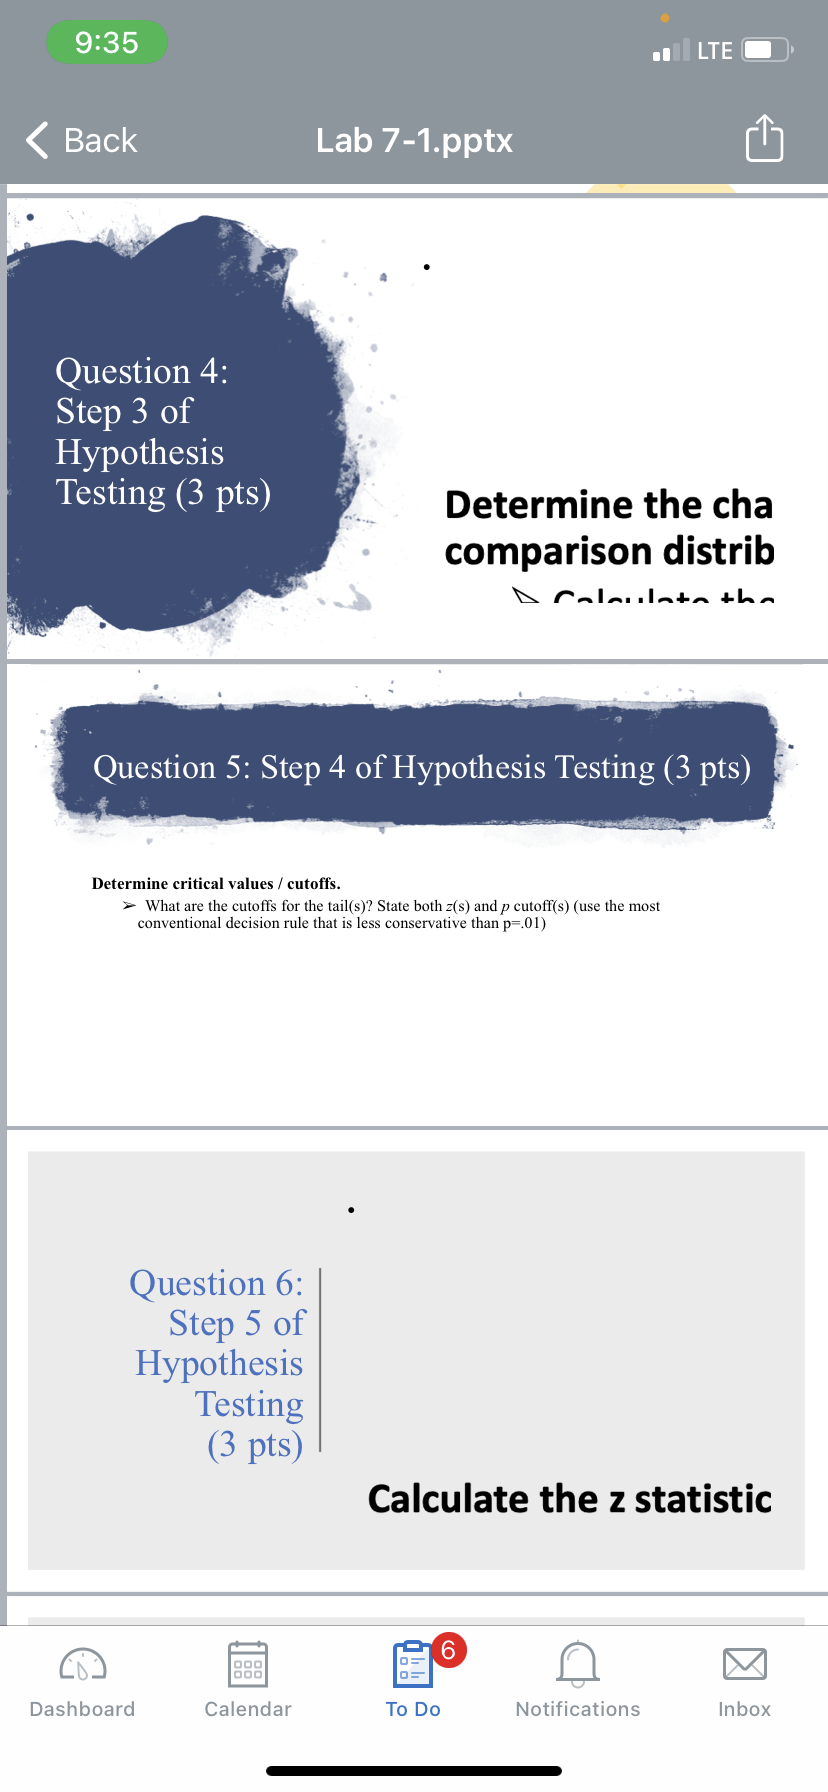
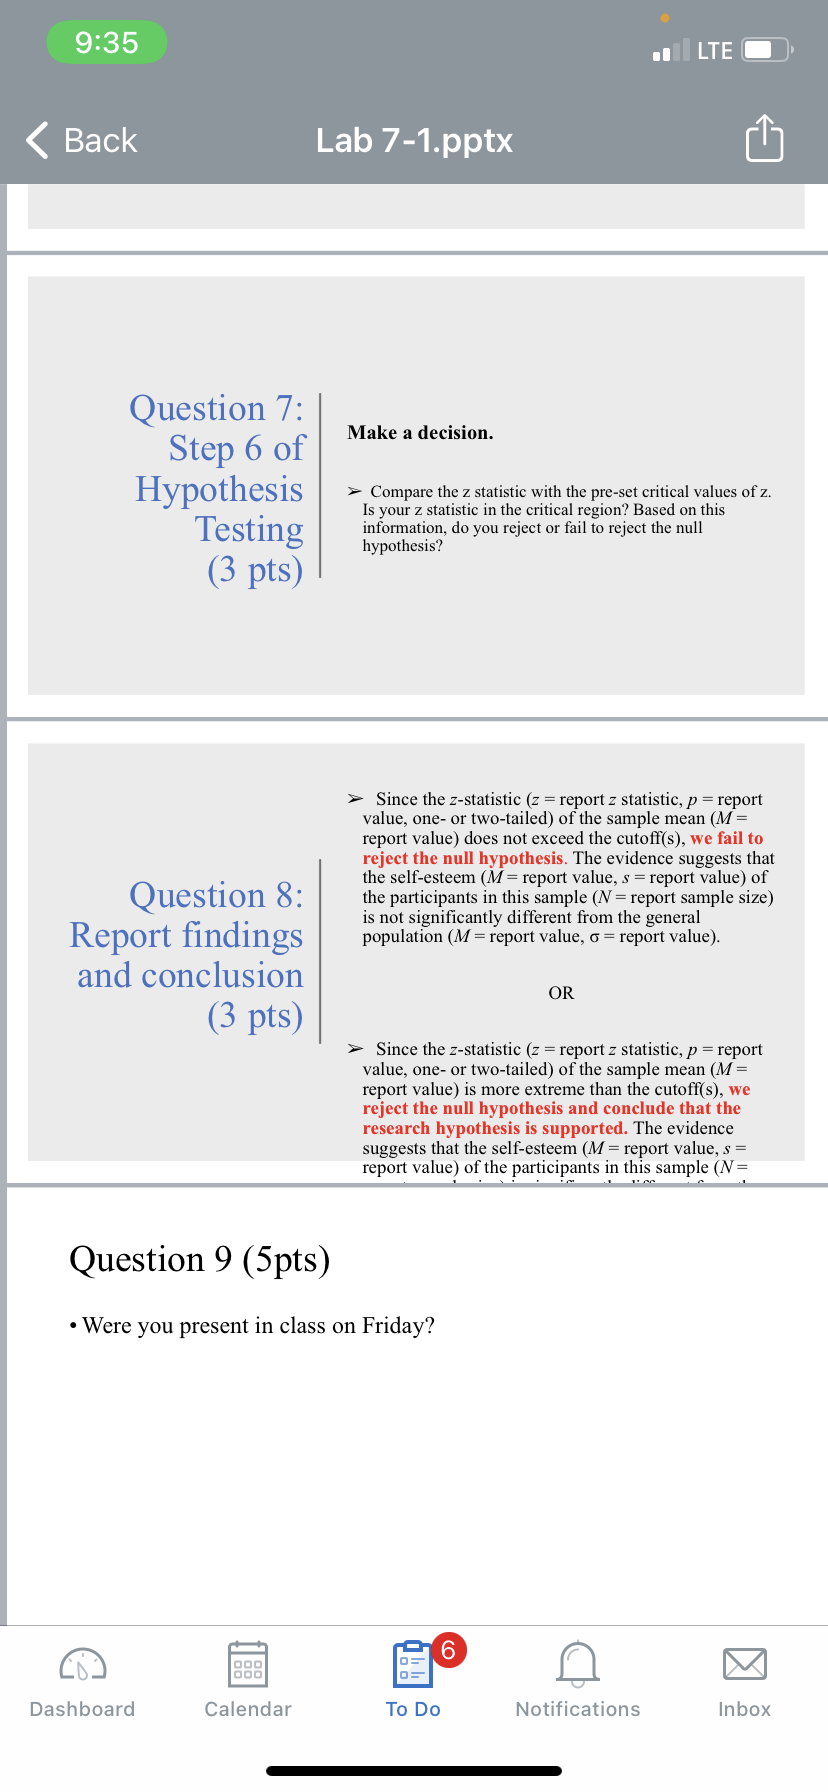
9:35 LTE Compare the z statistic with the pre-set critical values of z. Is your z statistic in the critical region? Based on this Testing information, do you reject or fail to reject the null hypothesis? (3 pts) > Since the z-statistic (z = report z statistic, p = report value, one- or two-tailed) of the sample mean (M = report value) does not exceed the cutoff(s), we fail to reject the null hypothesis. The evidence suggests that Question 8: the self-esteem (M = report value, s = report value) of the participants in this sample (N = report sample size) Report findings is not significantly different from the general population (M = report value, o = report value). and conclusion OR (3 pts) > Since the z-statistic (z = report z statistic, p = report value, one- or two-tailed) of the sample mean (M = report value) is more extreme than the cutoff(s), we reject the null hypothesis and conclude that the research hypothesis is supported. The evidence suggests that the self-esteem (M = report value, s = report value) of the participants in this sample (N = Question 9 (5pts) . Were you present in class on Friday? OF 6 0= Dashboard Calendar To Do Notifications Inbox9:34 LTE
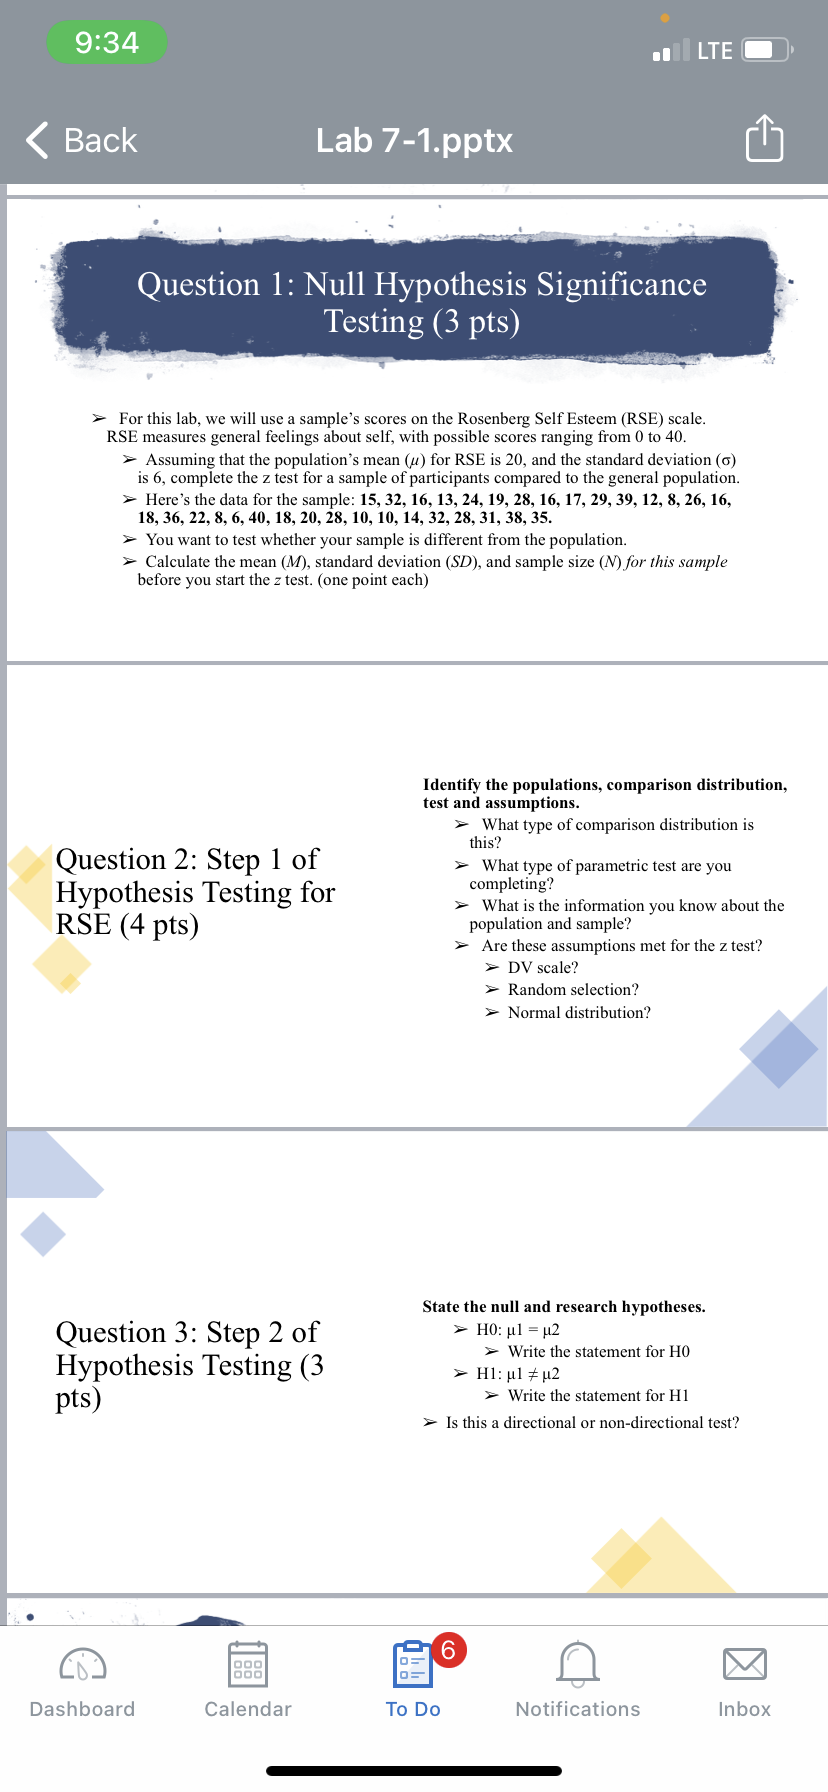
For this lab, we will use a sample's scores on the Rosenberg Self Esteem (RSE) scale. RSE measures general feelings about self, with possible scores ranging from 0 to 40. > Assuming that the population's mean (u) for RSE is 20, and the standard deviation (6) is 6, complete the z test for a sample of participants compared to the general population. Here's the data for the sample: 15, 32, 16, 13, 24, 19, 28, 16, 17, 29, 39, 12, 8, 26, 16, 18, 36, 22, 8, 6, 40, 18, 20, 28, 10, 10, 14, 32, 28, 31, 38, 35. > You want to test whether your sample is different from the population. > Calculate the mean (M), standard deviation (SD), and sample size (N) for this sample before you start the z test. (one point each) Identify the populations, comparison distribution, test and assumptions. What type of comparison distribution is this? Question 2: Step 1 of What type of parametric test are you Hypothesis Testing for completing? What is the information you know about the RSE (4 pts) population and sample? > Are these assumptions met for the z test? DV scale? Random selection? Normal distribution? State the null and research hypotheses. Question 3: Step 2 of > HO: H1 = 12 Hypothesis Testing (3 Write the statement for HO pts) Write the statement for HI Is this a directional or non-directional test? OF 6 0= X Dashboard Calendar To Do Notifications Inbox


