I am having trouble solving these questions
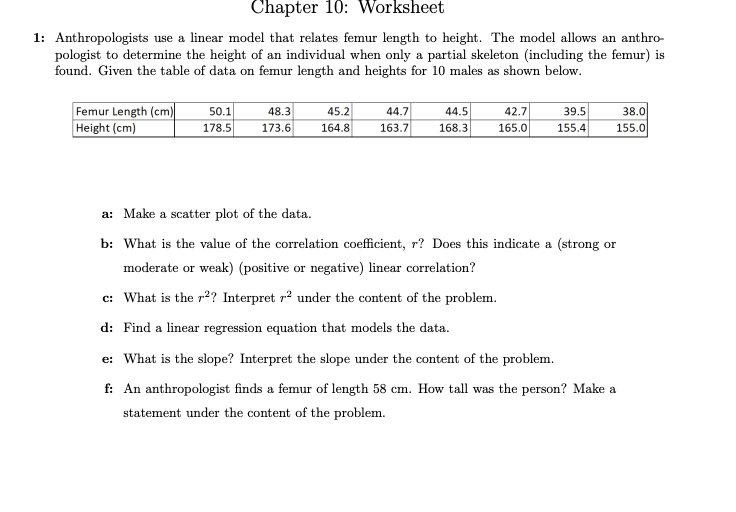
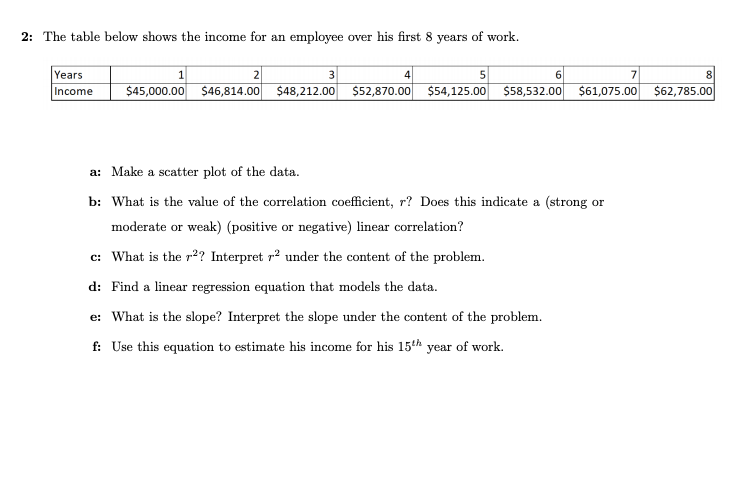
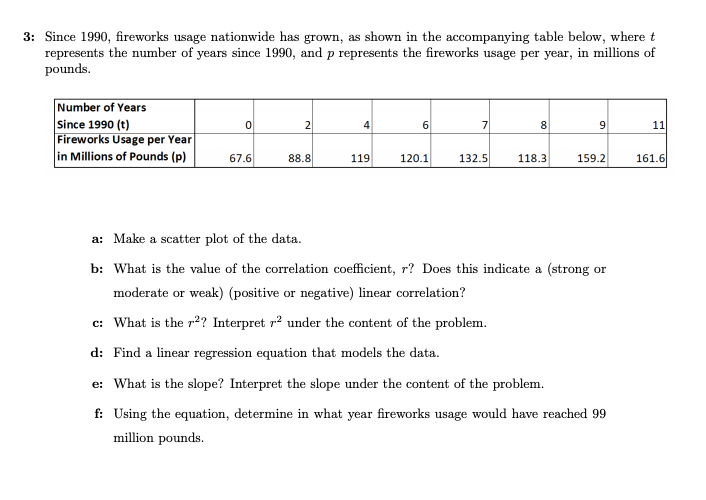
Chapter 10: Worksheet 1: Anthropologists use a linear model that relates femur length to height. The model allows an anthro- pologist to determine the height of an individual when only a partial skeleton (including the femur) is found. Given the table of data on femur length and heights for 10 males as shown below. Femur Length (cm) 50.1 48.3 45.2 44.7 44.5 42.7 39.5 38.0 Height (cm) 178.5 173.6 164.8 163.7 168.3 165.0 155.4 155.0 a: Make a scatter plot of the data. b: What is the value of the correlation coefficient, "? Does this indicate a (strong or moderate or weak) (positive or negative) linear correlation? c: What is the '? Interpret ~ under the content of the problem. d: Find a linear regression equation that models the data. e: What is the slope? Interpret the slope under the content of the problem. f: An anthropologist finds a femur of length 58 cm. How tall was the person? Make a statement under the content of the problem.2: The table below shows the income for an employee over his first 8 years of work. Years 1 3 4 5 6 7 8 Income $45,000.00 $46,814.00 $48,212.00 $52,870.00 $54,125.00 $58,532.00 $61,075.00 $62,785.00 a: Make a scatter plot of the data. b: What is the value of the correlation coefficient, "? Does this indicate a (strong or moderate or weak) (positive or negative) linear correlation? c: What is the 27 Interpret ' under the content of the problem. d: Find a linear regression equation that models the data. e: What is the slope? Interpret the slope under the content of the problem. f: Use this equation to estimate his income for his 15"* year of work.3: Since 1990, fireworks usage nationwide has grown, as shown in the accompanying table below, where t represents the number of years since 1990, and p represents the fireworks usage per year, in millions of pounds. Number of Years Since 1990 (t) 0 2 A 6 7 9 11 Fireworks Usage per Year in Millions of Pounds (p) 67.6 88.8 119 120.1 132.5 118.3 159.2 161.6 a: Make a scatter plot of the data. b: What is the value of the correlation coefficient, ? Does this indicate a (strong or moderate or weak) (positive or negative) linear correlation? c: What is the r27 Interpret ~ under the content of the problem. d: Find a linear regression equation that models the data. e: What is the slope? Interpret the slope under the content of the problem. f: Using the equation, determine in what year fireworks usage would have reached 99 million pounds