I am lost. please help.
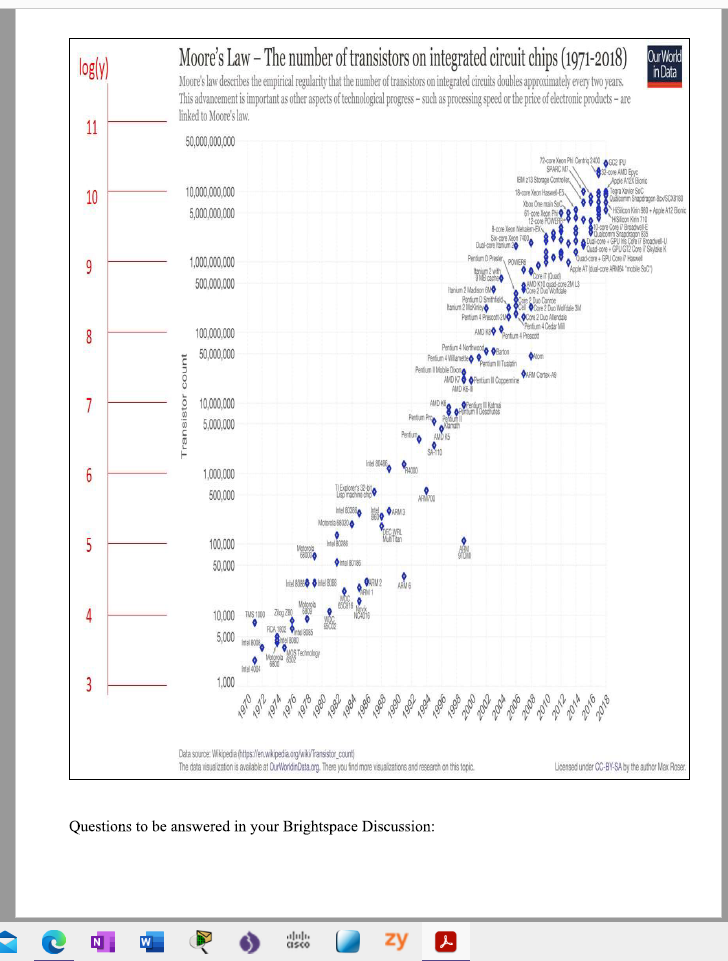
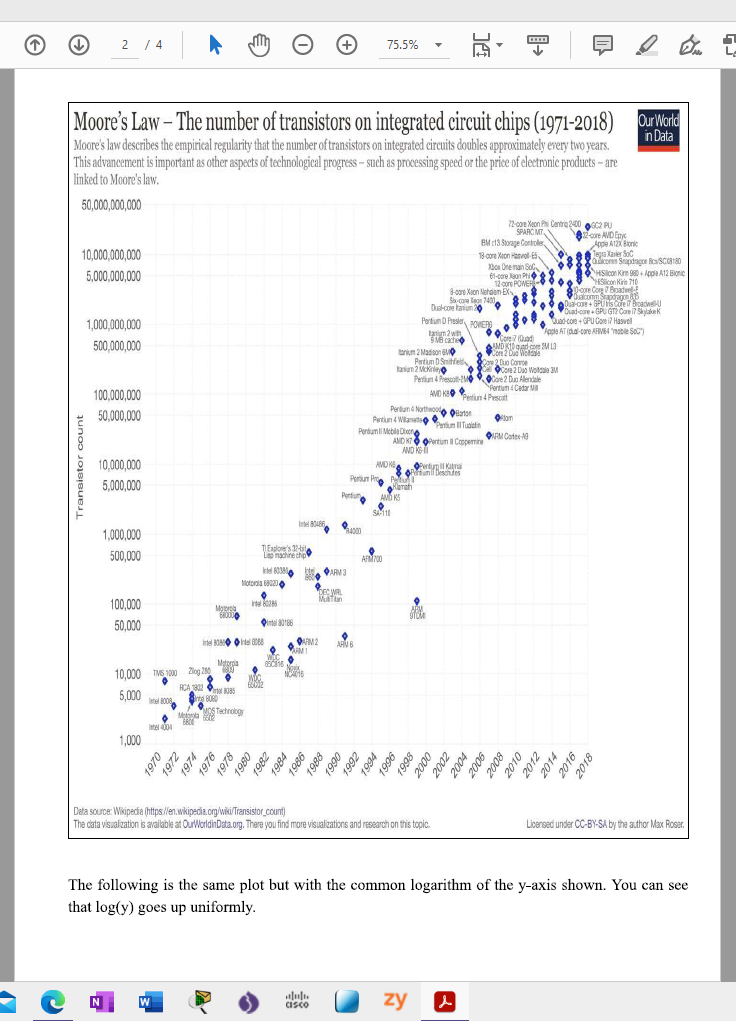
U '5." ' I- U 1...!- \" IHI v r I'- III-\\- WIUUHIE Il'l'l' UliLl-IJJIU" WEE-3'40"- Solve the problem below. Copy the description of your forecast in the box below and include that as part of your initial Discussion post in Brightspace. Using "copy" 'om here in Mobius and "paste[1 into Brightspace should work. Hint: The chart is taken 'om httpsiftourworldindata.orgitechnologicalprogress {https:fi'ourworldindatanrgttechnologicalprogress). From the chart, estimate {roughly} the number of transistors per IC in 2018. Using your estimate and Moore's Law, what would you predict the number of transistors per IC to be in 204D? In some applications, the variable being studied increases so quickly (\"exponentially") that a regular graph isn't informative. There, a regular graph would show data close to II] and then a sudden spike at the very end. Instead, for these applications, we often use logarithmic scales. We replace the yaxis tick marks of 1, 2, s, 4, ctc. with yaxis tick marks of to1 = to, to2 = too, 103 = 1000, l\" = lfi, etc. In other words, the logarithms of the new tick marks are equally spaced. Technology is one area where progress is extraordinarily rapid. Moore's Law states that the progress of technology (measured in different ways) doubles every 2 years. A common example counts the number of transitors per integrated circuit. A regular ya'sis scale is appropriate when a trend is linear, i.e. l transistors, EDD transistors, 3W transistors, 4D!) transistors, etc. However, technology actually increased at a much quicker pace such as l transistors.LilltlI transistors, l, transistors, l transistors, etc. The following is a plot of the number of transistors per integrated circuit over the period 19?1 2MB taken from https:fi'ourworldindatanrgftechnologicalprogress {https:t'i'ourworldindatanrgitechnologicalprogress) [that site contains a lot of data, not just for technology). At first, this graph seems to show a steadyr progression until you look carefully at the yaxis it's not linear. From the graph, it seems that from 19?] to 1931 the number of transistors went from about Lilith} to 4t},t]. Moore's Law predicts that in it) years, it would double 5 times, i.e. go from LOUD to 32,t}, and the actual values {using very rough estimates} seem to support this. Moore's [aw - The number of transistors on intssratoti circuit chins t inn-2mm m agate-accurat- logly) Moore's Law - The number of transistors on integrated circuit chips (1971-2018) OurWorld Moore's law describes the empirical regularity that the number of transistors on integrated circuits doubles approximately every two years. This advancement is important as other aspects of technological progress - such as processing speed or the price of electronic products - are linked to Moore's law. 11 50,000,000,000 SPARCN 3 -COME AND Eye BMI 219 Storage Controlon 10 10,000,000.000 19-ware Xeon Hasael-ES. 5,000,000.000 "Histoo Kim Il LO 1,000,000,000 500,000,000 ianum 2 Madison BUG CO 100,000.000 AND WEDo 50,000,000 Perfor 4 Northapollo Offlaton Transistor count 10,080.000 5,000.000 1,000.000 500.000 Un 100.000 50.000 10.000 TUS 10 Ding 20 5,000 W 1.000 1970 1972 1974 1980 1984 1989 2000 2006 2010 2012 2014 2016 2018 Data source Wikipedia (https Werwikipediaaghakil transistor county The data visualization is available at OurWorldin Data org. There you find more visitlications and research on this topic Diseased under OC-BY-SA by the author Max Roger. Questions to be answered in your Brightspace Discussion: W CISCO zy XT 2 /4 + 75.5% Moore's Law - The number of transistors on integrated circuit chips (1971-2018) Our World Moore's law describes the empirical regularity that the number of transistors on integrated circuits doubles approximately every two years. in Data This advancement is important as other aspects of technological progress - such as processing speed or the price of electronic products - are linked to Moore's law. 50,000,000,000 72-care Xeon Pal Contra 2400 6:902 PU SPARCMY -core AMD Epyc BM r13 Storage Controller Appa AllX Boris 10,000,000,000 18-com Xion Hasvol-ES Tegra Kanter Soc When One main Sol gotfoor Smapdago Bca SCC8180 5,000,000,000 HIS con Kirin 980 + Appla A12 Bignic d-care Xeon Mehdian Shecong Meon 7401 Dual-coe lawon 20 Dia-con + BRUIris Core IT Bicacwell-U 1,000,000,000 Penton D Presker, POWER 'Quad core . GPU GT2 Care if Shopbake K Quad-com + GPU Gone if Haswel Apple AT (dual-care AFIMEd "mable SOC" 500,000,000 arium 2 Madison GVIQ Parthm DSmitte are & Dun Compe "Core 2 Duo Woldble IM Core 2 Duo Alendale 100,000,000 AND KID "Pentium 4 Cedar Mi Proton 4 Prescott 50,000,000 Pentium II Tualatin Pentium II Mobile Diane AMDET @ @Pentium II Copperring 91PM Cates-14 Translator count 10.000,000 Ofchini Deschutes 5,000,000 1410 1,000,000 500,000 AR 700 PARM3 100,000 50,000 10,000 TMS 1000 Zig 280 5,000 Intel 8008 1.000 1970 1972 1974 1976 1978 1980 1982 1984 1986 1988 1990 1992 1934 1906 1908 2000 2002 2004 2006 2908 2010 2012 2014 2016 2018 Data source: Wikipedia (https //en.wikipedia. org/wiki/Transistor_count) The data visualization is available at OurWorldinData.org. There you find more visualizations and research on this topic. Licensed under CC-BY-SA by the author Max Roser. The following is the same plot but with the common logarithm of the y-axis shown. You can see that log(y) goes up uniformly. IN W zy XPart a: The number of transistors per IC in 1972 seems to be about 4,000 (a rough estimate by eye). Using this estimate and Moore's Law, what would you predict the number of transistors per IC to be 20 years later, in 1992? Prediction = Number Part b: From the chart, estimate (roughly) the number of transistors per IC in 2018. Using your estimate and Moore's Law, what would you predict the number of transistors per IC to be in 2040? Part c: Do you think that your prediction in Part b is believable? Why or why not? W zy X


