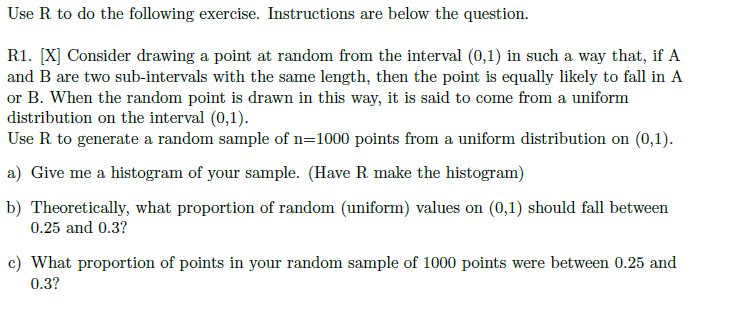
Question: I am taking a 300 level statistics class and we are required to use a program called R. I need to make a histrogram. I
I am taking a 300 level statistics class and we are required to use a program called "R". I need to make a histrogram. I am really confused and need lots of help. Below are the instructions. If someone can help me, I would appriceate it

Use R to do the following exercise. Instructions are below the question R1. X Consider drawing a point at random from the interval (0,1) in such a way that, if A and B are two sub-intervals with the same length, then the point is equally likely to fall in A or B. When the random point is drawn in this way, it is said to come from a uniform distribution on the interval (0,1) Use R to generate a random sample of n=1000 points from a uniform distribution on (0,1). a) Give me a histogram of your sample. (Have R make the histogram) b) Theoretically, what proportion of random (uniform) values on (0,1) should fall between 0.25 and 0.3? c What proportion of points in your random sample of 1000 points were between 0.25 and 0.3
Step by Step Solution
There are 3 Steps involved in it

Get step-by-step solutions from verified subject matter experts


