

Question: I am using MatLab and I am not sure how to do these problems. Can you please write the code that I need inorder to
I am using MatLab and I am not sure how to do these problems. Can you please write the code that I need inorder to solve the problem? The last image is the population.txt data and I shared a link for the data. It will be greatly appreciated! Thanks in advanced and I will rate appropriatly.
https://docs.google.com/document/d/1DdCakcSZlrStujS_WWSyeDIKiB-JqA5KRUf6WCydChM/edit?usp=sharing
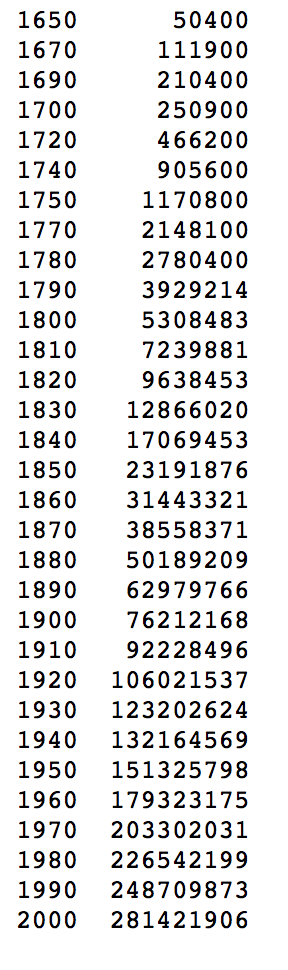
This is the data for the population.txt
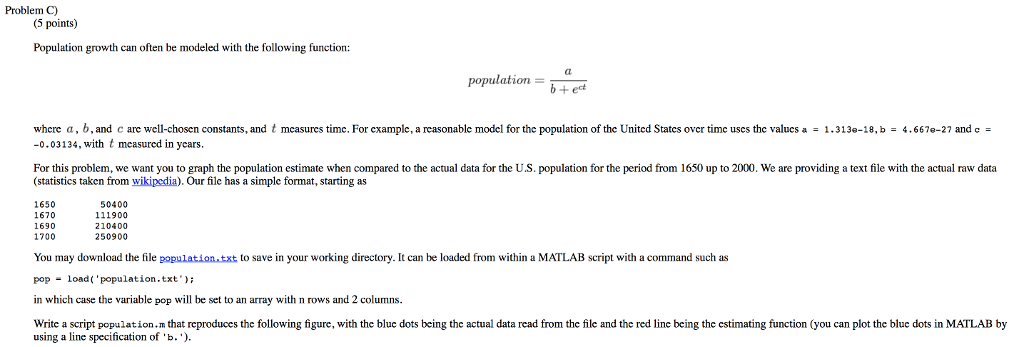
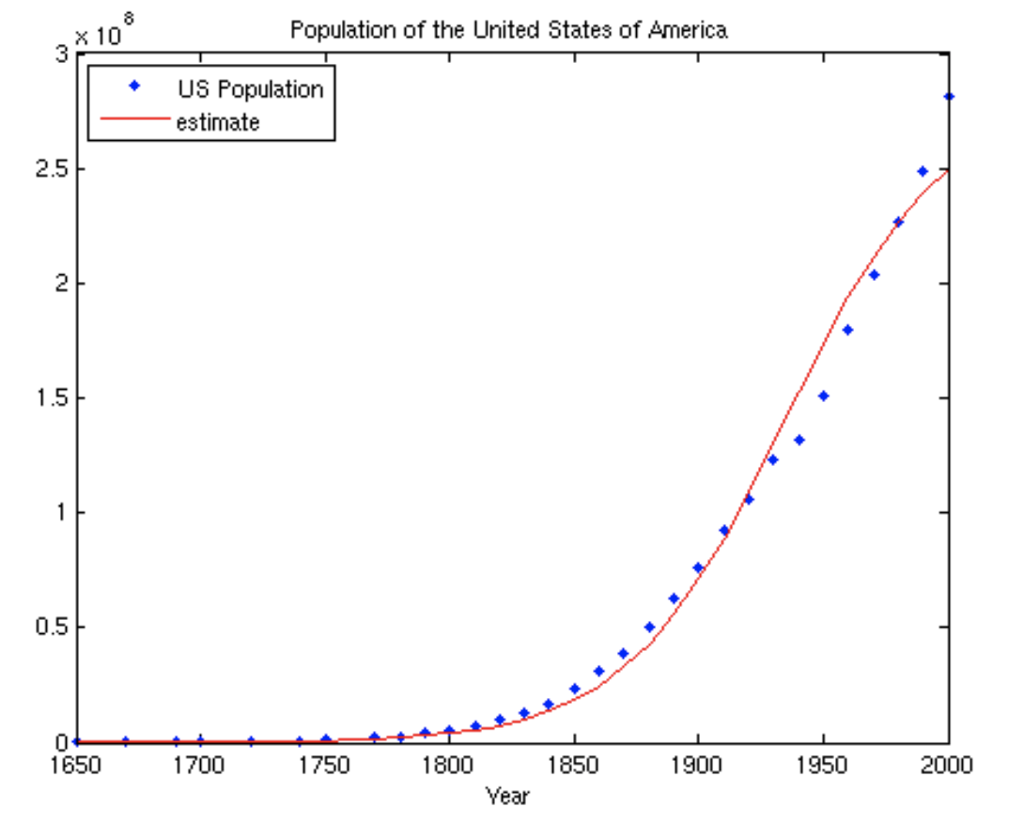
Problem C) (5 points) Population growth can often be modeled with the following function: population = D+ where a , b, and c are well-chosen constants, and t measures time. For example, a reasonable model for the population of the United States over time uses the values= 1.313e-18, b = 4.667e-27 and c -0.03134, with t measured in ycars. For this problem, we want you to graph the population estimate when compared to the actual data for the U.S. population for the period from 1650 up to 2000. We are providing a text file with the actual raw data (statistics taken from wikipedia). Our file has a simple format, starting as 1650 1670 1690 1700 50400 111900 210400 250900 to save in your working directory. It can be loaded from within a MATLAB script with a command such as You may download the file popload'population.txt in which case the variable pop will be set to an array with n rows and 2 columns Write a script population.m that reproduces the following figure, with the blue dots being the actual data read from the file and the red line being the cstimating function (you can plot the blue dots in MATLAB by using a line specification of b.') Problem C) (5 points) Population growth can often be modeled with the following function: population = D+ where a , b, and c are well-chosen constants, and t measures time. For example, a reasonable model for the population of the United States over time uses the values= 1.313e-18, b = 4.667e-27 and c -0.03134, with t measured in ycars. For this problem, we want you to graph the population estimate when compared to the actual data for the U.S. population for the period from 1650 up to 2000. We are providing a text file with the actual raw data (statistics taken from wikipedia). Our file has a simple format, starting as 1650 1670 1690 1700 50400 111900 210400 250900 to save in your working directory. It can be loaded from within a MATLAB script with a command such as You may download the file popload'population.txt in which case the variable pop will be set to an array with n rows and 2 columns Write a script population.m that reproduces the following figure, with the blue dots being the actual data read from the file and the red line being the cstimating function (you can plot the blue dots in MATLAB by using a line specification of b.')
Step by Step Solution
There are 3 Steps involved in it

Get step-by-step solutions from verified subject matter experts