

Answered step by step
Verified Expert Solution
Question
1 Approved Answer
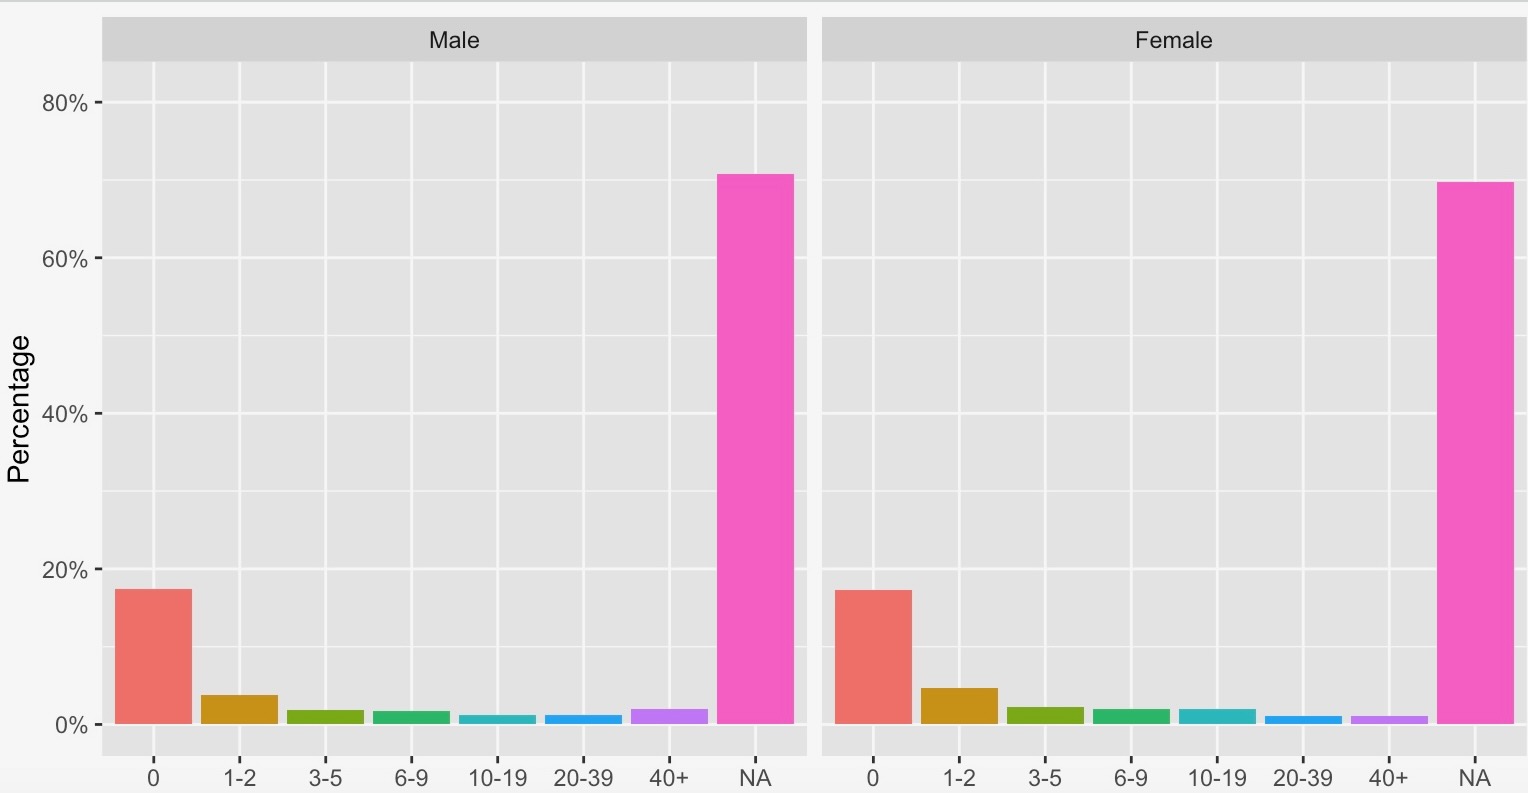
I am working with r studio trying to make a bar graph to show if there is a correlation between 2 of my variables. My
I am working with r studio trying to make a bar graph to show if there is a correlation between of my variables. My code works but my graph has NA values on it How can I remove the NA values? The data name is Final and my variables are Drink and Gender.
My code:
myplot ggplotFinal aesDrink group Gender
geombaraesy prop.., fill factorx stat"count"
scaleycontinuouslabelsscales::percent
ylabPercentage
facetgrid~Gender
Step by Step Solution
There are 3 Steps involved in it
Step: 1

Get Instant Access to Expert-Tailored Solutions
See step-by-step solutions with expert insights and AI powered tools for academic success
Step: 2

Step: 3
Ace Your Homework with AI
Get the answers you need in no time with our AI-driven, step-by-step assistance
Get Started
Microsoft Outlook 2023
Authors: James Holler
1st Edition
B0BP9P1VWJ, 979-8367217322