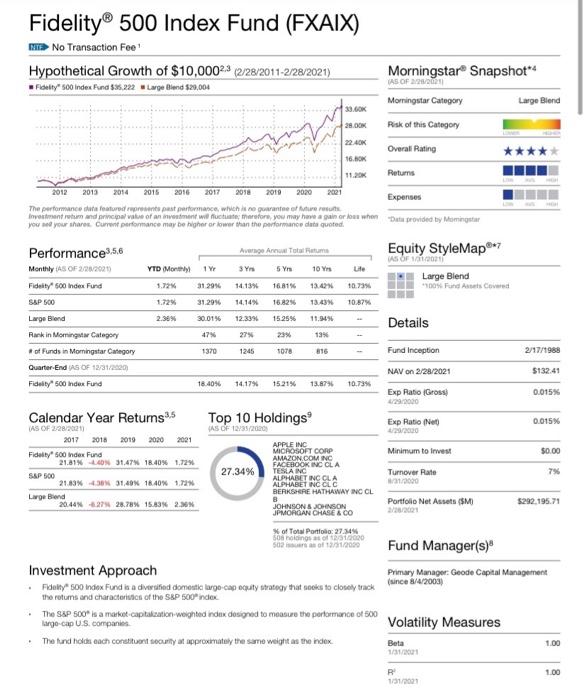
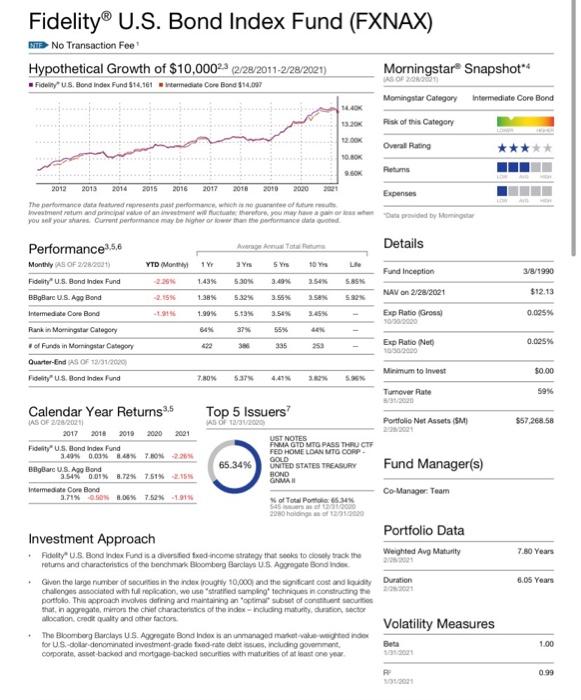
I answered question 1 already, but question 2 and 3 are all apart of eachother. one picture is the data (the blue one) for number 2. and the other picture (the green one) is an index
for #3.
Question #1 (Using average and standard deviation of annual returns, 15 points): Fill in your answers in the blanks for each of the empty yellow highlighted cells in the table below.
| Mutual fund in the video and Power Point file | | Fidelity U.S. Bond Index Fund |
a.) Average of the last 10 years of annual returns | | | |
b.) Standard deviation of annual returns | | | |
c.) Our best forecast of next years return | | | |
d.) For 68% of years, we should expect the annual return will not be lower than: | | | |
e.) For 68% of years, we should expect the annual return will not be higher than: | | | |
Question #2 (Analyzing 5 years of returns for the Stock fund, 15 points): Use the pdf for the Fidelity 500 Index Fund. This is the Stock fund we analyzed last week. Find the Calendar Year Returns table on page 1 of the pdf. It shows the annual returns for the years 2017 through 2021. As discussed in the video and Power Point file, there is a 16% probability that the return in any year will be worse than the number you calculated for row d of the above table for this fund (i.e., the center column, row d). There is a 16% probability that the return in any year will be better than the number you calculated for row e.
Were there any years in which the Stock funds Calendar Year Return was worse (i.e., lower) than its row dnumber? If so, which year?
Were there any years in which the Stock funds Calendar Year Return was better (i.e., higher) than its row e number? If so, which year?
Question #3 (Analyzing 5 years of returns for the Bond fund, 15 points): Repeat what you just did in Question #2 using the Fidelity U.S. Bond Index Fund pdf. This is the Bond fund we analyzed last week. Find the Calendar Year Returns table on page 1 of the pdf that shows the annual returns for the years 2017 through 2021. Compare the returns to the numbers you calculated for the right column of the table on the last page in rows d and e.
Were there any years in which the Bond funds Calendar Year Return was worse (i.e., lower) than its row d number? If so, which year?
Were there any years in which the Bond funds Calendar Year Return was better (i.e., higher) than its row e number? If so, which year?


Fidelity 500 Index Fund (FXAIX) MD No Transaction Fee Hypothetical Growth of $10,0002.3 (2/28/2011-2/28/2021) Fidelty" so Index Fund $36.222 Large Bland $20,004 Morningstar Snapshot** TAS OF 2202 Morningstar Category Large Blend 39.00K Risk of this Category Overall Rating 16.GOK Retums 2012 2013 2014 2015 2016 2017 2018 2010 2020 2021 Expenses The performance of featured represents past parformance, which he reparantee of turret Inventum and principal value of an investment will fluctuate refore, you may hain or four when Data provided by Moming you your share. Curformance may be higher or lower than the performance dute quoted Performance 35,6 Ave A Totaltum *7 Equity StyleMap? AS OF Monthly A5 OF 2/202020) YTO MO 19 3Y 5 Y 10 Y Lite Large Blend Fidelity 500 Index Fund 31295 14139 16.81% 13.42 10.73 100% Fund Ants Covered S&P 500 31.29% 14.14% 16.82% 13:43 10.87% Large Blend 2.38% 30.01% 12.33 15.25% 11.969 Details Rank in Moming Category 47% 27% 2396 19% of Funds in Momingstar Category 1370 1245 1078 816 Fund Inception 2/17/1988 Quarter-End AS OF 12/31/2020 NAV on 2/28/2021 $132.41 Ficulty" 500 ndos Fund 18.40% 14.17% 15.21% 13.8796 10.739 Exp Ratio Grossi 0.015% Calendar Year Returns Top 10 Holdings Exp Ratio Net 0.015% AS OF 12/05/2020 Minimum to invest $0.00 IAS OF 2/28/20211 2017 2018 2019 2020 2021 Fidelity 500 Index Fund 21.01% UN 31.47 18.40% 1.72% S&P 500 21.09% 430% 31,40% 16.40% 172 Large Blend 27.34% 7% APPLE INC MICROSOFT CORP AMAZON.COM INC FACEBOOK INCOLA TESLA ING ALPHABET INC CLA ALPHABET INGOLC BERKSHIRE HATHAWAY INC CL B JOHNSON & JOHNSON JPMORGAN CHABACO Turnover Rate 1/2000 20:44 -2.279 28,78% 15,43% 2.30* Portfolio Net Assets (SM 2/28/2001 5292.195.71 of Total Portfolio: 27.4% 508 is of 2020 Son of 12000 Fund Manager(s) Primary Manager: Geode Capital Management (since 8/4/2003) Investment Approach . dalys index Fundia a diversified domestic largo-capeculty strategy that socks to closely track the returns and characteristics of the SAP 500 index The S&P 500 is a market capitalization weighted and designed to measure the performance of 500 largo-cap U.S.companies The hand hold each constituent security at approximately the same weight as the index Volatility Measures 1.00 Beta 1/31/2001 1.00 R 1/31/2001 Fidelity U.S. Bond Index Fund (FXNAX) No Transaction Fee Hypothetical Growth of $10,000 (2/28/2011-2/28/2021) Morningstar Snapshot AS OF FidUS. Bond Index Fund $14.161 stermediate Core Bond $14.007 Momingstar Category intermediate Core Bond Risk of this Category Overall Rating 2010 3/8/1990 $12.13 0.025% 37% 0.025% $0.00 59% Reums 2012 2013 2014 2015 2016 2017 2020 Expenses The performance atted resents a forma que o livestment retum and prepelile of an investment will be therefore, you may need to you so your current performance may be high or we are the performance chatted Performance3,5,8 Details Monthly AS OF 2/28/2011 YTD Monty 19 Y SY Fund Inception Fidelity U.S. Bond Index Fund -225 1.43% 5.30% 3.49% 25% S. BBBar U.S.Ag Bond NAV on 2/28/2001 1.38 5.32% 35 5.92 Intermediate Core Bond 1.90% 5.13 3.58% 35 Exp Rato Gross 100.000 Rank in Morning Category 84% of Funds in Morningstar Category 412 335 253 Exp Ratio Net Quarter-End AS OF 12/31/2000) Minimum to invest Fidelity" S. Bond Index Fund 7.80% 5:37 SEX Turnover Rate Calendar Year Returns35 Top 5 Issuers? S OF 2/28/2011 WAS OF 1/3200 Portfolio Net Assets (SM 2017 2011 2010 2000 2001 UST NOTES FidelityUS. Bond Index Fund PARAA GTD MTG PASS THRU CIF 3,40% 0.03% 84% 7.0 -2.26% FED HOME LOAN TO CORP GOLD BeBar U.S.Ag Bond 65.34% UNITED STATES TREASURY Fund Manager(s) 3.540.01% 8.72% 75% 15 BOND GNA Intermediate Core Bond 3.71% OSON8.06% 7.52% -1916 Co Manager: Team of Total Ponto S450 2010 2010 Investment Approach Portfolio Data doty" U.S. Bond Index Fund is a diversified fixed income strategy that sols to crack the Weighted Avg Maturity returns and characteristics of the benchmark Bloomberg Barclays U.S. Aggregate Bond Index Given the large number of securities in the index rougtuy 90.000) and the significant cost and loudy Duration challenges associated with full replication, we use stratified samping techniques in constructing te 20.2021 porttolo. This approach involves defining and maintaining an optimal sub of content surto that in aggregate, mirrors the chief characteristics of the index - Including maturity, dution sector location. Credit quality and other factors Volatility Measures The Blomberg Barclays US Aggregate Bond Index is an unmanaged at vokse weighted for US.-do-denominated investment grade federate debes, cluding government Beta corporate, asset-backed and mortgage-backed securities with matures of atoast one you $57,268.58 7.80 Years 6.05 Years 1.00 0.99 Fidelity 500 Index Fund (FXAIX) MD No Transaction Fee Hypothetical Growth of $10,0002.3 (2/28/2011-2/28/2021) Fidelty" so Index Fund $36.222 Large Bland $20,004 Morningstar Snapshot** TAS OF 2202 Morningstar Category Large Blend 39.00K Risk of this Category Overall Rating 16.GOK Retums 2012 2013 2014 2015 2016 2017 2018 2010 2020 2021 Expenses The performance of featured represents past parformance, which he reparantee of turret Inventum and principal value of an investment will fluctuate refore, you may hain or four when Data provided by Moming you your share. Curformance may be higher or lower than the performance dute quoted Performance 35,6 Ave A Totaltum *7 Equity StyleMap? AS OF Monthly A5 OF 2/202020) YTO MO 19 3Y 5 Y 10 Y Lite Large Blend Fidelity 500 Index Fund 31295 14139 16.81% 13.42 10.73 100% Fund Ants Covered S&P 500 31.29% 14.14% 16.82% 13:43 10.87% Large Blend 2.38% 30.01% 12.33 15.25% 11.969 Details Rank in Moming Category 47% 27% 2396 19% of Funds in Momingstar Category 1370 1245 1078 816 Fund Inception 2/17/1988 Quarter-End AS OF 12/31/2020 NAV on 2/28/2021 $132.41 Ficulty" 500 ndos Fund 18.40% 14.17% 15.21% 13.8796 10.739 Exp Ratio Grossi 0.015% Calendar Year Returns Top 10 Holdings Exp Ratio Net 0.015% AS OF 12/05/2020 Minimum to invest $0.00 IAS OF 2/28/20211 2017 2018 2019 2020 2021 Fidelity 500 Index Fund 21.01% UN 31.47 18.40% 1.72% S&P 500 21.09% 430% 31,40% 16.40% 172 Large Blend 27.34% 7% APPLE INC MICROSOFT CORP AMAZON.COM INC FACEBOOK INCOLA TESLA ING ALPHABET INC CLA ALPHABET INGOLC BERKSHIRE HATHAWAY INC CL B JOHNSON & JOHNSON JPMORGAN CHABACO Turnover Rate 1/2000 20:44 -2.279 28,78% 15,43% 2.30* Portfolio Net Assets (SM 2/28/2001 5292.195.71 of Total Portfolio: 27.4% 508 is of 2020 Son of 12000 Fund Manager(s) Primary Manager: Geode Capital Management (since 8/4/2003) Investment Approach . dalys index Fundia a diversified domestic largo-capeculty strategy that socks to closely track the returns and characteristics of the SAP 500 index The S&P 500 is a market capitalization weighted and designed to measure the performance of 500 largo-cap U.S.companies The hand hold each constituent security at approximately the same weight as the index Volatility Measures 1.00 Beta 1/31/2001 1.00 R 1/31/2001 Fidelity U.S. Bond Index Fund (FXNAX) No Transaction Fee Hypothetical Growth of $10,000 (2/28/2011-2/28/2021) Morningstar Snapshot AS OF FidUS. Bond Index Fund $14.161 stermediate Core Bond $14.007 Momingstar Category intermediate Core Bond Risk of this Category Overall Rating 2010 3/8/1990 $12.13 0.025% 37% 0.025% $0.00 59% Reums 2012 2013 2014 2015 2016 2017 2020 Expenses The performance atted resents a forma que o livestment retum and prepelile of an investment will be therefore, you may need to you so your current performance may be high or we are the performance chatted Performance3,5,8 Details Monthly AS OF 2/28/2011 YTD Monty 19 Y SY Fund Inception Fidelity U.S. Bond Index Fund -225 1.43% 5.30% 3.49% 25% S. BBBar U.S.Ag Bond NAV on 2/28/2001 1.38 5.32% 35 5.92 Intermediate Core Bond 1.90% 5.13 3.58% 35 Exp Rato Gross 100.000 Rank in Morning Category 84% of Funds in Morningstar Category 412 335 253 Exp Ratio Net Quarter-End AS OF 12/31/2000) Minimum to invest Fidelity" S. Bond Index Fund 7.80% 5:37 SEX Turnover Rate Calendar Year Returns35 Top 5 Issuers? S OF 2/28/2011 WAS OF 1/3200 Portfolio Net Assets (SM 2017 2011 2010 2000 2001 UST NOTES FidelityUS. Bond Index Fund PARAA GTD MTG PASS THRU CIF 3,40% 0.03% 84% 7.0 -2.26% FED HOME LOAN TO CORP GOLD BeBar U.S.Ag Bond 65.34% UNITED STATES TREASURY Fund Manager(s) 3.540.01% 8.72% 75% 15 BOND GNA Intermediate Core Bond 3.71% OSON8.06% 7.52% -1916 Co Manager: Team of Total Ponto S450 2010 2010 Investment Approach Portfolio Data doty" U.S. Bond Index Fund is a diversified fixed income strategy that sols to crack the Weighted Avg Maturity returns and characteristics of the benchmark Bloomberg Barclays U.S. Aggregate Bond Index Given the large number of securities in the index rougtuy 90.000) and the significant cost and loudy Duration challenges associated with full replication, we use stratified samping techniques in constructing te 20.2021 porttolo. This approach involves defining and maintaining an optimal sub of content surto that in aggregate, mirrors the chief characteristics of the index - Including maturity, dution sector location. Credit quality and other factors Volatility Measures The Blomberg Barclays US Aggregate Bond Index is an unmanaged at vokse weighted for US.-do-denominated investment grade federate debes, cluding government Beta corporate, asset-backed and mortgage-backed securities with matures of atoast one you $57,268.58 7.80 Years 6.05 Years 1.00 0.99


