

Question
I apologize if this is confusing, the first two pictures are of the same spread sheet, top pic is start of it and second pic
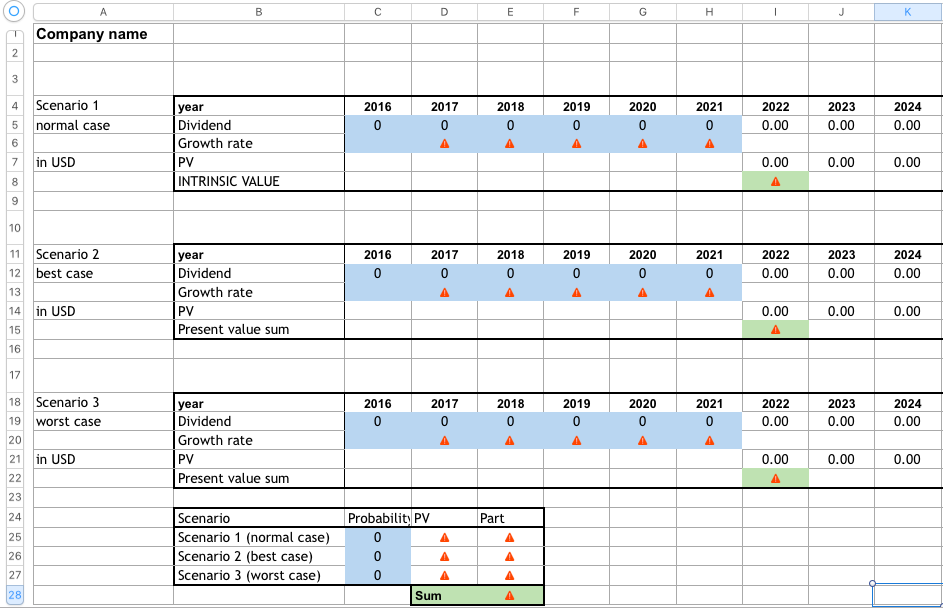
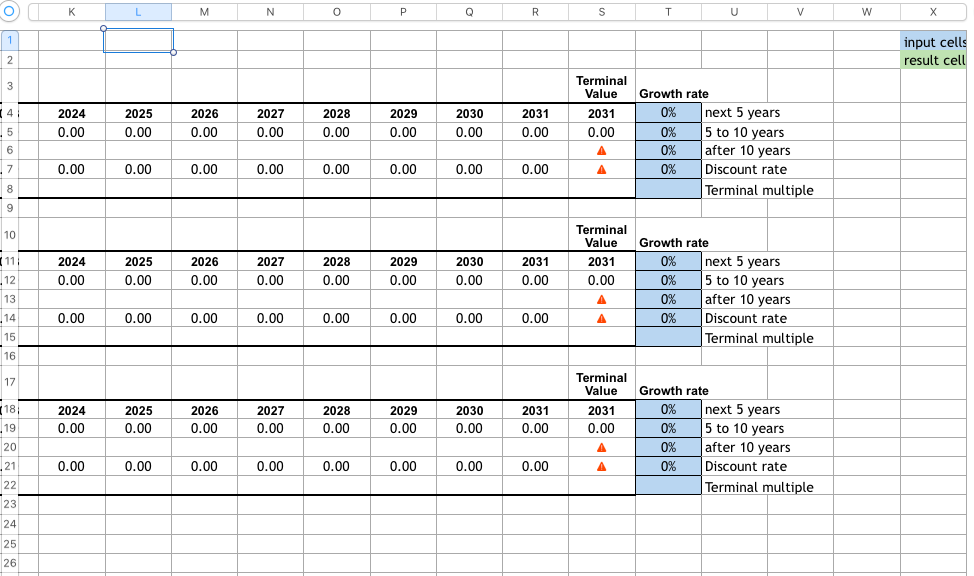
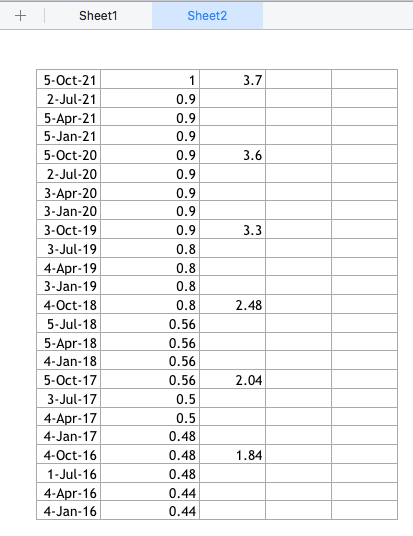
I apologize if this is confusing, the first two pictures are of the same spread sheet, top pic is start of it and second pic is end of spreadsheet, I just didn't have enough space to include it on one picture. Please find a dividend-paying stock, and use the DDM to compute its intrinsic value, thank you!
A B D E F H 1 J K Company name 2 3 4. Scenario 1 5 normal case 2016 0 2017 0 2018 0 2019 0 2020 0 2021 0 2022 0.00 2023 0.00 2024 0.00 1 6 year Dividend Growth rate PV INTRINSIC VALUE 7 in USD 0.00 0.00 0.00 8 9 10 2016 0 2017 0 2018 0 2020 0 2019 0 A 2021 0 2022 0.00 2023 0.00 11 Scenario 2 12 best case 13 14 in USD 15 2024 0.00 year Dividend Growth rate PV Present value sum 0.00 0.00 0.00 16 17 2016 0 2017 0 2018 0 2019 0 2020 0 2021 0 2022 0.00 2023 0.00 2024 0.00 18 Scenario 3 19 worst case 20 21 in USD 22 23 year Dividend Growth rate PV Present value sum 0.00 0.00 0.00 24 Part Probability PV 0 25 Scenario Scenario 1 (normal case) Scenario 2 (best case) Scenario 3 (worst case) 26 OOO 27 28 Sum O K L M N O Q R S T U V w 1 input cells result cell 2 3 Terminal Value 2031 0.00 2024 0.00 2025 0.00 2026 0.00 2027 0.00 2028 0.00 2029 0.00 2031 0.00 2030 0.00 14 5 6 6 .7 Growth rate 0% next 5 years 0% 5 to 10 years 0% after 10 years 0% Discount rate Terminal multiple 0.00 0.00 0.00 0.00 0.00 0.00 0.00 0.00 8 9 10 2024 (11 12 2025 0.00 2026 0.00 2027 0.00 2028 0.00 2029 0.00 2030 0.00 2031 0.00 Terminal Value 2031 0.00 0.00 Growth rate 0% next 5 years 0% 5 to 10 years 0% after 10 years 0 Discount rate Terminal multiple 13 14 0.00 0.00 0.00 0.00 0.00 0.00 0.00 0.00 A 0% 15 16 17 Terminal Value 2024 0.00 2025 0.00 2026 0.00 2027 0.00 2028 0.00 2029 0.00 2030 0.00 2031 0.00 18 19 20 .21 2031 0.00 A A Growth rate 0% next 5 years 0% 5 to 10 years 0% after 10 years 0% Discount rate Terminal multiple 0.00 0.00 0.00 0.00 0.00 0.00 0.00 0.00 22 23 24 25 26 + Sheet1 Sheet2 3.7 3.6 1 0.9 0.9 0.9 0.9 0.9 0.9 0.9 0.9 0.8 0.8 3.3 0.8 5-Oct-21 2-Jul-21 5-Apr-21 5-Jan-21 5-Oct-20 2-Jul-20 3-Apr-20 3-Jan-20 3-Oct-19 3-Jul-19 4-Apr-19 3-Jan-19 4-Oct-18 5-Jul-18 5-Apr-18 4-Jan-18 5-Oct-17 3-Jul-17 4-Apr-17 4-Jan-17 4-Oct-16 1-Jul-16 4-Apr-16 4-Jan-16 2.48 2.04 0.8 0.56 0.56 0.56 0.56 0.5 0.5 0.48 0.48 0.48 0.44 0.44 1.84 A B D E F H 1 J K Company name 2 3 4. Scenario 1 5 normal case 2016 0 2017 0 2018 0 2019 0 2020 0 2021 0 2022 0.00 2023 0.00 2024 0.00 1 6 year Dividend Growth rate PV INTRINSIC VALUE 7 in USD 0.00 0.00 0.00 8 9 10 2016 0 2017 0 2018 0 2020 0 2019 0 A 2021 0 2022 0.00 2023 0.00 11 Scenario 2 12 best case 13 14 in USD 15 2024 0.00 year Dividend Growth rate PV Present value sum 0.00 0.00 0.00 16 17 2016 0 2017 0 2018 0 2019 0 2020 0 2021 0 2022 0.00 2023 0.00 2024 0.00 18 Scenario 3 19 worst case 20 21 in USD 22 23 year Dividend Growth rate PV Present value sum 0.00 0.00 0.00 24 Part Probability PV 0 25 Scenario Scenario 1 (normal case) Scenario 2 (best case) Scenario 3 (worst case) 26 OOO 27 28 Sum O K L M N O Q R S T U V w 1 input cells result cell 2 3 Terminal Value 2031 0.00 2024 0.00 2025 0.00 2026 0.00 2027 0.00 2028 0.00 2029 0.00 2031 0.00 2030 0.00 14 5 6 6 .7 Growth rate 0% next 5 years 0% 5 to 10 years 0% after 10 years 0% Discount rate Terminal multiple 0.00 0.00 0.00 0.00 0.00 0.00 0.00 0.00 8 9 10 2024 (11 12 2025 0.00 2026 0.00 2027 0.00 2028 0.00 2029 0.00 2030 0.00 2031 0.00 Terminal Value 2031 0.00 0.00 Growth rate 0% next 5 years 0% 5 to 10 years 0% after 10 years 0 Discount rate Terminal multiple 13 14 0.00 0.00 0.00 0.00 0.00 0.00 0.00 0.00 A 0% 15 16 17 Terminal Value 2024 0.00 2025 0.00 2026 0.00 2027 0.00 2028 0.00 2029 0.00 2030 0.00 2031 0.00 18 19 20 .21 2031 0.00 A A Growth rate 0% next 5 years 0% 5 to 10 years 0% after 10 years 0% Discount rate Terminal multiple 0.00 0.00 0.00 0.00 0.00 0.00 0.00 0.00 22 23 24 25 26 + Sheet1 Sheet2 3.7 3.6 1 0.9 0.9 0.9 0.9 0.9 0.9 0.9 0.9 0.8 0.8 3.3 0.8 5-Oct-21 2-Jul-21 5-Apr-21 5-Jan-21 5-Oct-20 2-Jul-20 3-Apr-20 3-Jan-20 3-Oct-19 3-Jul-19 4-Apr-19 3-Jan-19 4-Oct-18 5-Jul-18 5-Apr-18 4-Jan-18 5-Oct-17 3-Jul-17 4-Apr-17 4-Jan-17 4-Oct-16 1-Jul-16 4-Apr-16 4-Jan-16 2.48 2.04 0.8 0.56 0.56 0.56 0.56 0.5 0.5 0.48 0.48 0.48 0.44 0.44 1.84Step by Step Solution
There are 3 Steps involved in it
Step: 1

Get Instant Access to Expert-Tailored Solutions
See step-by-step solutions with expert insights and AI powered tools for academic success
Step: 2

Step: 3
Ace Your Homework with AI
Get the answers you need in no time with our AI-driven, step-by-step assistance
Get Started
The Charles Schwab Guide To Finances After Fifty
Authors: Carrie Schwab-Pomerantz, Joanne Cuthbertson
1st Edition
0804137366, 978-0804137362