 I cant get the data file to upload to chegg, could you just put the code that the problem asks for.
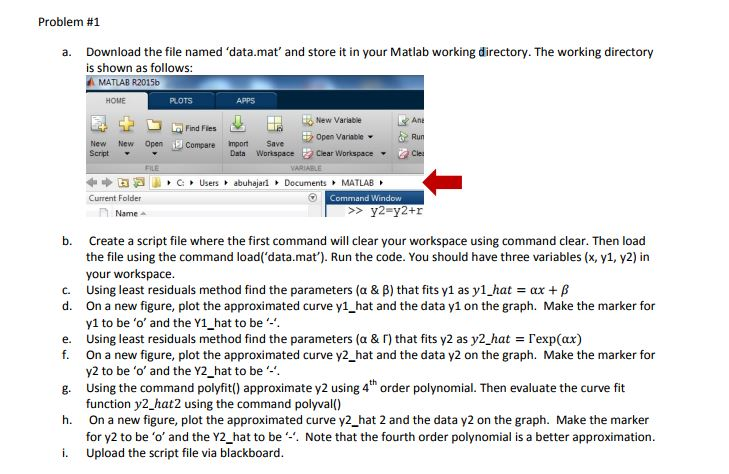
Problem #1 a. Download the file named 'data.mat' and store it in your Matlab working directory. The working directory is shown as follows: A MATLAB R2015b HOME PLOTS APPS E P G QFind Files IL FH New Variable Ant > Open Variable - Run New New Open Compare Import Save Script Data Workspace Clear Workspace - Cles eta Current Folder n Name C: Users + abuhajarl Documents + MATLAB O Command Window >> y2=y2+r i - ao b. Create a script file where the first command will clear your workspace using command clear. Then load the file using the command load('data.mat'). Run the code. You should have three variables (x, y1, y2) in your workspace. Using least residuals method find the parameters (a & B) that fits y1 as y1_hat = ax +B d. On a new figure, plot the approximated curve y1_hat and the data y1 on the graph. Make the marker for yl to be 'o' and the Y1_hat to be . Using least residuals method find the parameters (a &r) that fits y2 as y2_hat = Texp(ax) On a new figure, plot the approximated curve y2_hat and the data y2 on the graph. Make the marker for y2 to be 'o' and the Y2_hat to be Using the command polyfit() approximate y2 using 4" order polynomial. Then evaluate the curve fit function y2_hat2 using the command polyval() On a new figure, plot the approximated curve y2_hat 2 and the data y2 on the graph. Make the marker for y2 to be 'o' and the Y2_hat to be. Note that the fourth order polynomial is a better approximation. i. Upload the script file via blackboard. Problem #1 a. Download the file named 'data.mat' and store it in your Matlab working directory. The working directory is shown as follows: A MATLAB R2015b HOME PLOTS APPS E P G QFind Files IL FH New Variable Ant > Open Variable - Run New New Open Compare Import Save Script Data Workspace Clear Workspace - Cles eta Current Folder n Name C: Users + abuhajarl Documents + MATLAB O Command Window >> y2=y2+r i - ao b. Create a script file where the first command will clear your workspace using command clear. Then load the file using the command load('data.mat'). Run the code. You should have three variables (x, y1, y2) in your workspace. Using least residuals method find the parameters (a & B) that fits y1 as y1_hat = ax +B d. On a new figure, plot the approximated curve y1_hat and the data y1 on the graph. Make the marker for yl to be 'o' and the Y1_hat to be . Using least residuals method find the parameters (a &r) that fits y2 as y2_hat = Texp(ax) On a new figure, plot the approximated curve y2_hat and the data y2 on the graph. Make the marker for y2 to be 'o' and the Y2_hat to be Using the command polyfit() approximate y2 using 4" order polynomial. Then evaluate the curve fit function y2_hat2 using the command polyval() On a new figure, plot the approximated curve y2_hat 2 and the data y2 on the graph. Make the marker for y2 to be 'o' and the Y2_hat to be. Note that the fourth order polynomial is a better approximation. i. Upload the script file via blackboard
 I cant get the data file to upload to chegg, could you just put the code that the problem asks for.


