I completed all of the excel sheets. I am just having a rough time doing the analysis part. Please ASSIST!!! :)
Questions below:
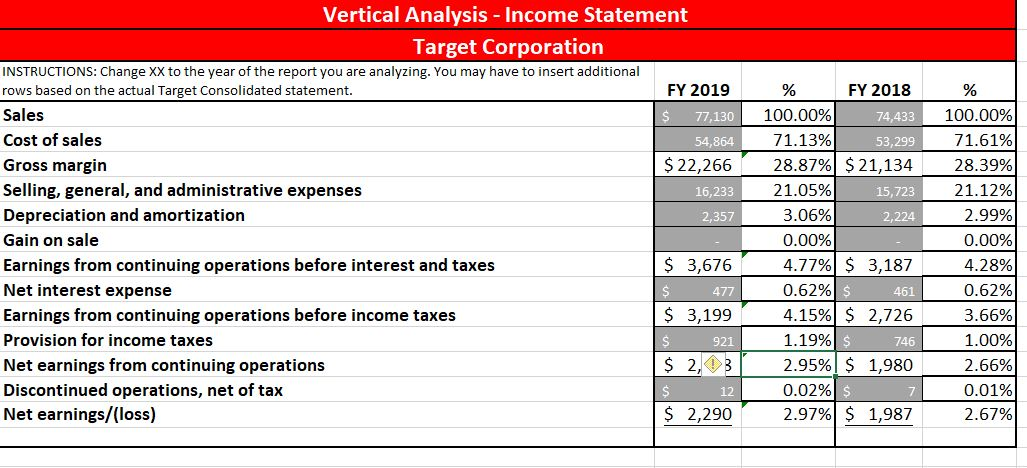
- Using the vertical analysis of the income statements, identify the significant trends
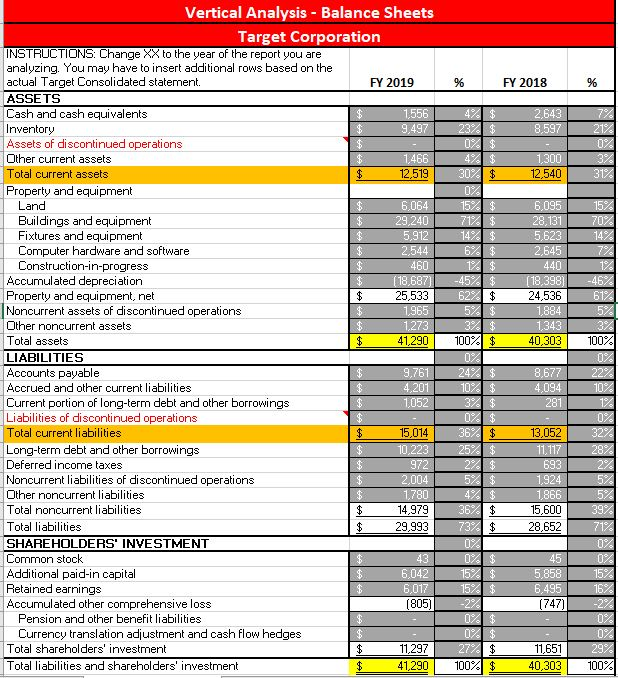
- Using the vertical analysis of the balance sheets, identify the significant trends
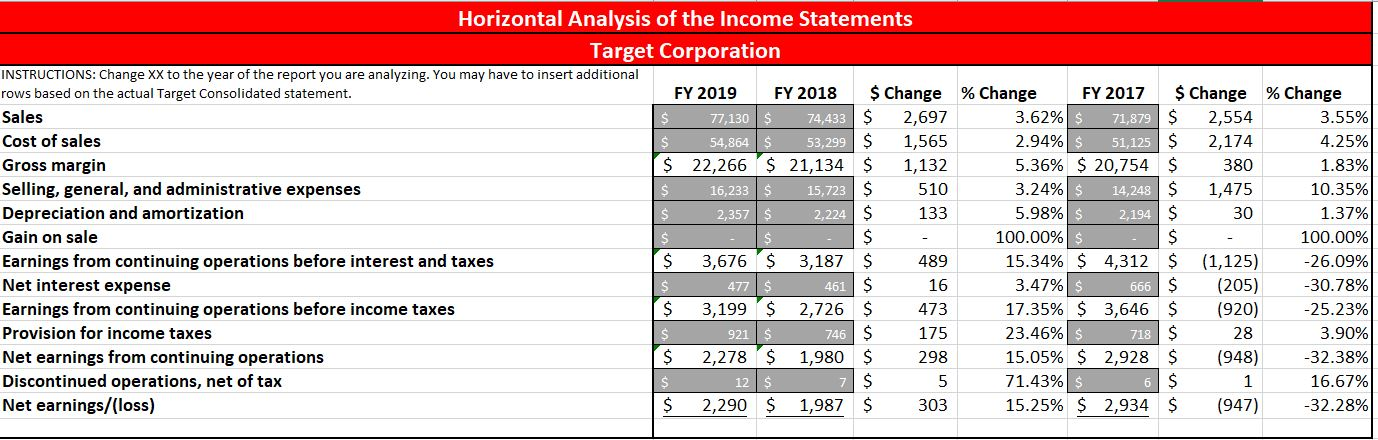
- Using the horizontal analysis of the income statements, identify the significant trends
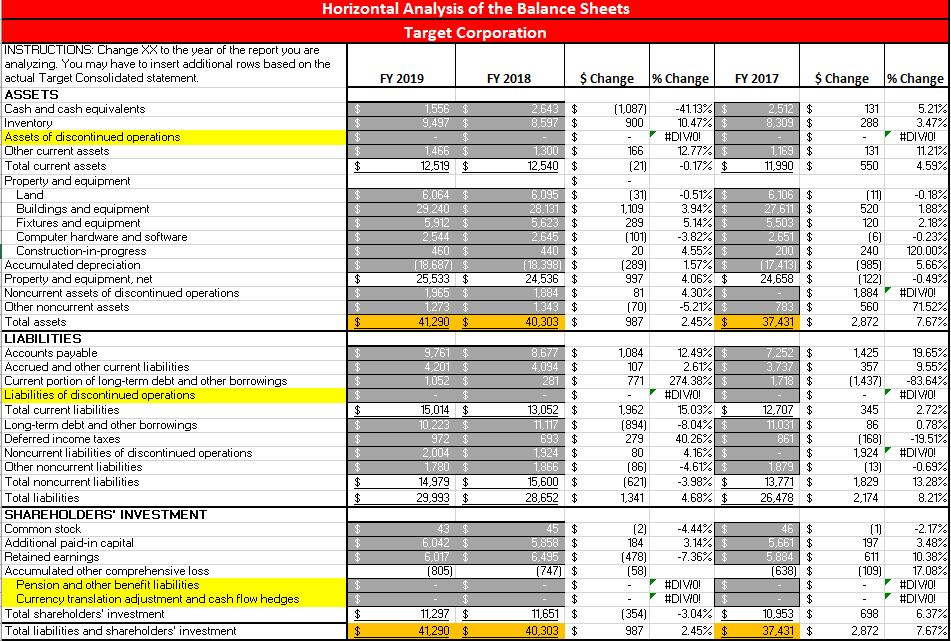
- Using the horizontal analysis of the balance sheets, identify the significant trends
% FY 2018 % 2,643 8.597 21. 23% $ 0% $ 1,300 12,540 0% 3% 31% Vertical Analysis - Balance Sheets Target Corporation INSTRUCTIONS: Change XX to the year of the report you are analyzing. You may have to insert additional rows based on the actual Target Consolidated statement. FY 2019 ASSETS Cash and cash equivalents 1556 Inventory 9.497 Assets of discontinued operations Other current assets $ 1,466 Total current assets $ 12,519 Property and equipment Land $ 6,064 Buildings and equipment 29,240 Fixtures and equipment 5,912 Computer hardware and software 2,544 Construction-in-progress $ 460 Accumulated depreciation $ (18,687) Property and equipment, net $ 25,533 Noncurrent assets of discontinued operations $ 1965 Other noncurrent assets 1.273 Total assets $ 41,290 LIABILITIES Accounts payable $ 9,761 Accrued and other current liabilities 4,201 Current portion of long-term debt and other borrowings 1052 Liabilities of discontinued operations Total current liabilities $ 15,014 Long-term debt and other borrowings $ 10,223 Deferred income taxes 972 Noncurrent liabilities of discontinued operations 2,004 Other noncurrent liabilities $ 1780 Total noncurrent liabilities 14,979 Total liabilities 29,993 SHAREHOLDERS' INVESTMENT Common stock 43 Additional paid-in capital 6,042 Retained earnings $ 6,017 Accumulated other comprehensive loss (805) Pension and other benefit liabilities Currency translation adjustment and cash flow hedges Total shareholders' investment 11,297 Total liabilities and shareholders' investment $ 41,290 30$ 0% 15%$ 71% $ 14% $ 6% $ 1% -45$ 62% $ 5% $ 3%$ 100%A $ 0% 24% $ 10% $ 6,095 28, 131 5,623 2,645 440 (18,3981 24,536 1,884 1,343 40,303 | 8,677 4,094 281 0% $ 36 $ 25$ 15% 70% 14% 7% 1% -46% 61% 5% 3% 100% 0% 22% 10% 1% 0% 32% 28% 2% 5% 5% 39% 71% 0% 0% 15% 16% -2% 0% 0% 29% 100% 13,052 11.117 693 1.924 1,866 15,600 28,652 1 5$ 4% $ 36% $ 73%$ 0% 0% $ 15% $ 15% $ -22 45 5,858 6,495 (747) . $ 0% $ 27%$ 100%A $ 11,651 40,303 Vertical Analysis - Income Statement Target Corporation INSTRUCTIONS: Change XX to the year of the report you are analyzing. You may have to insert additional rows based on the actual Target Consolidated statement. FY 2019 Sales $ 77,130 Cost of sales 54,864 Gross margin $ 22,266 Selling, general, and administrative expenses 16,233 Depreciation and amortization 2,357 Gain on sale Earnings from continuing operations before interest and taxes $ 3,676 Net interest expense $ 477 Earnings from continuing operations before income taxes $ 3,199 Provision for income taxes $ 921 Net earnings from continuing operations $ 2,3 Discontinued operations, net of tax $ 12 Net earnings/(loss) $ 2,290 % FY 2018 100.00% 74,433 71.13% 53,299 28.87% $ 21,134 21.05% 15,723 3.06% 2,224 0.00% 4.77% $ 3,187 0.62% $ 461 4.15% $ 2,726 1.19% $ 746 2.95% $ 1,980 0.02% $ 2.97% $ 1,987 % 100.00% 71.61% 28.39% 21.12% 2.99% 0.00% 4.28% 0.62% 3.66% 1.00% 2.66% 0.01% 2.67% Horizontal Analysis of the Income Statements Target Corporation INSTRUCTIONS: Change XX to the year of the report you are analyzing. You may have to insert additional rows based on the actual Target Consolidated statement. FY 2019 FY 2018 $ Change % Change FY 2017 $ Change % Change Sales S 77,130 $ 74,433 $ 2,697 3.62% $ 71,879 S 2,554 3.55% Cost of sales $ 54,864 $ 53,299 $ 1,565 2.94% $ 51,125$ 2,174 4.25% Gross margin $ 22,266 $ 21,134 $ 1,132 5.36% $ 20,754 $ 380 1.83% Selling, general, and administrative expenses $ 16,233 $ 15,723 S 510 3.24% $ 14,248 $ 1,475 10.35% Depreciation and amortization S 2,357 $ 2,224 S 133 5.98% $ 2,194 $ 30 1.37% Gain on sale $ $ 100.00% $ 100.00% Earnings from continuing operations before interest and taxes $ 3,676 $ 3,187 $ 489 15.34% $ 4,312 $ (1,125) -26.09% Net interest expense $ 477 $ 461 $ 16 3.47% 666 $ (205) -30.78% Earnings from continuing operations before income taxes $ 3,199 2,726 $ 473 17.35% $ 3,646 $ (920) -25.23% Provision for income taxes $ 921 $ 746 $ 175 23.46% 718 $ 28 3.90% Net earnings from continuing operations $ 2,278 $ 1,980 $ 298 15.05% $ 2,928 $ (948) -32.38% Discontinued operations, net of tax $ 12$ 7 $ 5 71.43% 6 $ 1 16.67% Net earnings/(loss) $ 2,290 $ 1,987 S 303 15.25% $ 2,934 $ (947) -32.28% $ - $ FY 2017 $ Change % Change 131 288 2,512 $ 8,309 $ $ 1.169 $ 11.990 $ 5.21% 3.47% #DIVIO! 11.21% 4.59% $ 131 550 Horizontal Analysis of the Balance Sheets Target Corporation INSTRUCTIONS: Change XX to the year of the report you are analyzing. You may have to insert additional rows based on the actual Target Consolidated statement. FY 2019 FY 2018 $ Change % Change ASSETS Cash and cash equivalents 1,556 $ 2,643 $ (1,087) -41.13% 3 Inventory 9.497 $ 8.597 $ 900 10.47% Assets of discontinued operations $ #DIVO! $ Other current assets $ 1,466 1,300 $ 166 12.77%$ Total current assets $ 12,519 $ 12,540 $ (21) -0.17% $ Property and equipment $ Land 6,064 6,095 $ (31) -0.51% $ Buildings and equipment 29,240 $ 28,131 $ 1,109 3.94% $ Fixtures and equipment 5,912 $ 5,623 $ 289 5.14% $ Computer hardware and software 2.544 $ 2,645 $ (101) -3.82% Construction-in-progress 460 $ 440 $ 20 4.55%$ Accumulated depreciation (18,687) $ (18,398] $ (289) 1.57% Property and equipment, net $ 25,533 $ 24,536 $ 997 4.06% $ Noncurrent assets of discontinued operations $ 1.965 $ 1,884 $ 81 4.30% $ Other noncurrent assets 1,273 $ 1,343 $ (70) -5.21% Total assets 41,290 $ 40,303 $ 987 2.45% $ LIABILITIES Accounts payable 9.761 $ 8,677 $ 1,084 12.49% $ Accrued and other current liabilities 4,201 $ 4,094 $ 107 2.61% $ Current portion of long-term debt and other borrowings 1,052 $ 281 $ 771 274.38% $ Liabilities of discontinued operations $ #DIVIO! Total current liabilities 15,014 $ 13,052 $ 1,962 15.03% $ Long-term debt and other borrowings 10,223 $ 11,117 $ (894) -8.04% $ Deferred income taxes 972 $ 693 $ 279 40.26% $ Noncurrent liabilities of discontinued operations $ 2.004 $ 1.924 $ 80 4.16% $ Other noncurrent liabilities $ 1.780 1.866 $ (86) -4.6124 $ Total noncurrent liabilities 14,979 $ 15,600 $ (621) -3.98% $ Total liabilities $ 29,993 $ 28,652 $ 1,341 4.68% $ SHAREHOLDERS' INVESTMENT Common stock 43 45 $ (2) -4.44% $ Additional paid-in capital 6,042 5,858 $ 184 3.14% $ Retained earnings 6,017 $ 6,495 $ (478) -7.364 $ Accumulated other comprehensive loss (805) (747) $ (58) Pension and other benefit liabilities $ #DIV/0! $ Currency translation adjustment and cash flow hedges $ #DIV/0! $ Total shareholders' investment $ 11,297 $ 11,651 $ (354) -3.04% $ Total liabilities and shareholders' investment $ 41,290 $ 40,303 $ 987 2.45% $ 6,106 $ 27,611 $ 5,503 $ 2,651 $ 200 $ (17,413) $ 24,658 $ $ 783 $ 37,431 $ (11) 520 120 (6) 240 (985) (122) 1,884 560 2,872 -0.18% 1.88% 2.18% -0.23% 120.00% 5.66% -0.49% #DIVIO! 71.52% 7.67% 1,425 357 (1,437) $ 7.252 $ 3,737 $ 1,718 $ $ 12,707 $ 11,031 $ 861 $ $ 1.879 $ 13,771 $ 26,478 $ 345 86 19.65% 9.55% -83.6474 #DIVIO! 2.7274 0.78%A -19.5124 #DIVO! -0.69% 13.28% 8.21% (168) 1,924 (13) 1,829 2,174 $ | $ (1) 197 611 (109) 46 $ 5,661 $ 5,884 $ (638) $ $ $ 10,953 $ 37,431 $ -2.17% 3.48% 10.38% 17.08% #DIV/0! #DIV/0! 6.37% 7.67% 698 2,872