Answered step by step
Verified Expert Solution
Link Copied!

Question

1 Approved Answer

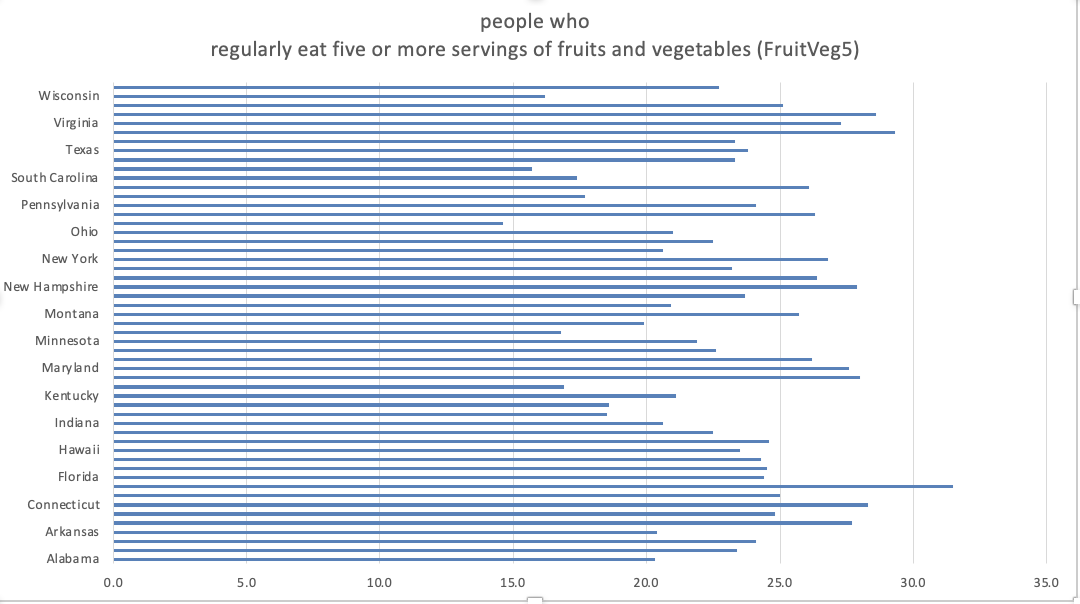
I created the graph I just need the rest of the questions answered people who regularly eat five or more servings of fruits and vegetables

image text in transcribed

I created the graph I just need the rest of the questions answered

image text in transcribedimage text in transcribed
people who regularly eat five or more servings of fruits and vegetables (FruitVeg5) Wisconsin Virginia Texas South Carolina Pennsylvania Ohio New York New Hampshire Montana Minnesota Maryland Kentucky Indiana Hawaii Florida Connecticut Arkansas Alabama 0.0 5.0 10.0 15.0 20.0 25.0 30.0 35.0(a) Prepare a graphical display of the distribution and use your display to describe the major features of the distribution. (b) Calculate numerical summaries. Give reasons for your choices. (c) Write a short paragraph summarizing What the data tell us

Step by Step Solution

There are 3 Steps involved in it

Step: 1

blur-text-image

Get Instant Access to Expert-Tailored Solutions

See step-by-step solutions with expert insights and AI powered tools for academic success

Step: 2

blur-text-image

Step: 3

blur-text-image

Ace Your Homework with AI

Get the answers you need in no time with our AI-driven, step-by-step assistance

Get Started

Recommended Textbook for

Functional Analysis And The Feynman Operator Calculus

Authors: Tepper L Gill, Woodford W Zachary, Zachary Woodford

1st Edition

331927595X, 9783319275956

More Books

Students also viewed these Mathematics questions