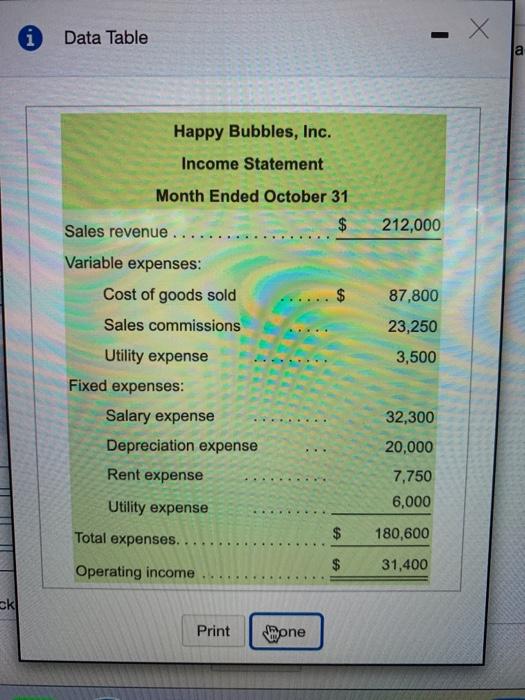
i Data Table a Happy Bubbles, Inc. Income Statement Month Ended October 31 Sales revenue $ 212,000 Variable expenses: Cost of goods sold Sales commissions 87,800 23,250 3,500 Utility expense Fixed expenses: Salary expense Depreciation expense 32,300 20,000 Rent expense 7,750 6,000 Utility expense Total expenses. $ 180,600 31,400 Operating income ok Print Wone 6 of 8 (5 complete) Data Table per Output Unit Output Units (Kits) 65,000 70,000 75,000 Sales revenue $ 2.90 $ 188,500 $ 203,000 $ 217,500 1.25 81,250 93.750 Variable expenses: Cost of goods sold Sales commissions Utility expense 0.30 19,500 87,500 21,000 3,500 22,500 0.05 3,250 3,750 Fixed expenses: Salary expense Depreciation expense Rent expense Utility expense 30,000 20,000 8,000 6,000 $ 168,000 $ 30,000 33,000 20,000 23,000 8,000 12,000 6,000 6,000 176,000 $ 194,000 Total expenses $ 20,500 $ Operating income 27,000 $ 23,500 Print Done MAR 28 MacBook Pro Score: 0 of 2 pts 6 of 8 (5 complete) P10-44A (similar to) Happy Bubbles, Inc. produces multicolored bubble solution used for weddings and other events. The company sold 70.000 bubble kits during October, and its actual (Click the icon to view the actual income statement.) The company's flexible budget income statement for October follows: Click the icon to view the flexible budget income statement.) Read the requirements Output units 70.000 65,000 Sales revenue 212,000 $ 9,000 F $ 203 000 S 14,500 F $ 188,500 Variable expenses Cost of goods sold 87.800 300 U 87.500 6,250 U 81,250 Sales commissions expense 23,250 2.250 U 21.000 1,500U 1000 Utility expense 6000 2500 3,500 250 U 3,250 Fixed expenses Salary expenso Depreciation expense W Rent expense Utility expense Total expenses Operating income Choose from any list or enter any number in the input fields and then click Check Answer. 4 parts remaining Clear All