I did not it , snd I do not now how , but I provide the balance sheet .
thank you
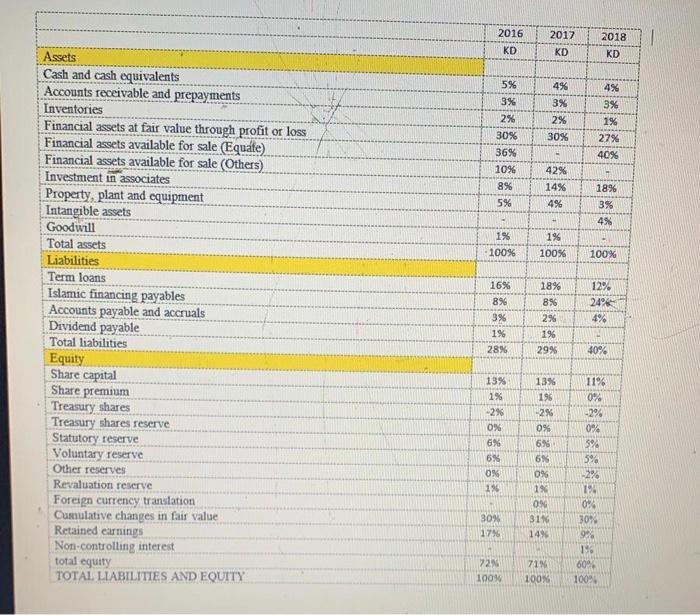
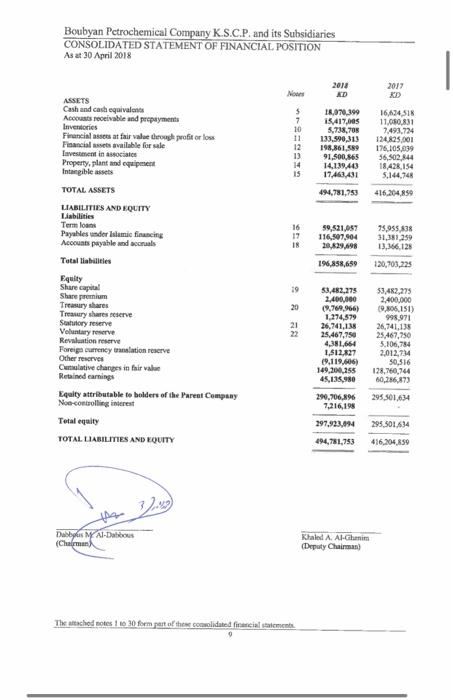
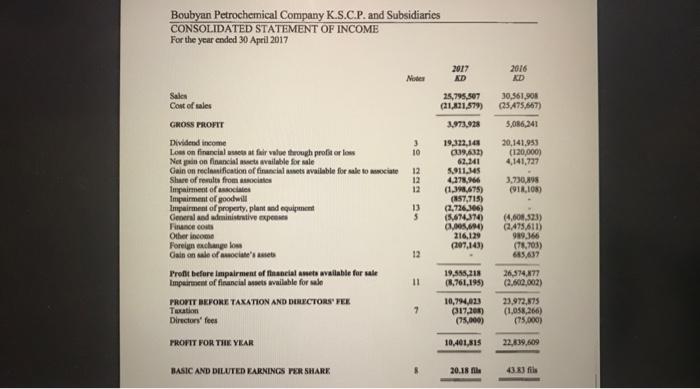
2016 KD 2018 2017 KD KD 5% 4% 3% 2% 30% 3% 25 30% 36% 10% 8% 5% 4% 3% 1% 27% 40% 42% 14% 4% 18% 3% 4% 1% 100% 1% 100% 100% Assets Cash and cash equivalents Accounts receivable and prepayments Inventories Financial assets at fair value through profit or loss Financial assets available for sale (Equate) Financial assets available for sale (Others) Investment in associates Property, plant and equipment Intangible assets Goodwill Total assets Liabilities Term loans Islamic financing payables Accounts payable and accruals Dividend payable Total liabilities Equity Share capital Share premium Treasury shares Treasury shares reserve Statutory reserve Voluntary reserve Other reserves Revaluation reserve Foreign currency translation Cumulative changes in fair value Retained earnings Non controlling interest total equity TOTAL LIABILITIES AND EQUITY 16% 896 3% 1% 28% 18% 896 29 196 29% 12% 24% 4% 40% 13% 1% -2% 0% 6% 6% 0% 1% 13% 196 -2% 0% 6% 6% 0% 1% 0% 31% 14% 11% 0% -2% 0% 5% 5% -29 194 0% 30% 99% 196 30% 17% 600 72 100% 71% 100% 100% V. Income Statement Anahis Comment on the common size incoe statement. Indicatie overall performance is favorable or - Prepare a common size income statement for the company assigned to unfavorable. (100 words) 20 pts D) Answer the following is the largest class of income and expenses of the company Determine which income and expertise items are major on the latest (2015) income statement give the information in WORD. 2) Tell the Gross Profit Ratio Operating Profit Ratio and Net Protit Ratio separately for each year 2018, 2017 and 2016) Did the company improved After you provide the ratios, comment on the profitability. Write your brief comment in WORD. profitability compared to the price years? Why! Conclusion References Write a brief concession for Deliverable L. What is the scope of week. What did you learn from this Deliverable. (100 words) Provide references Boubyan Petrochemical Company K.S.C.P. and its subsidiaries CONSOLIDATED STATEMENT OF FINANCIAL POSITION As at 30 April 2018 2011 KD 2017 XD $ 7 10 11 12 13 14 15 18,970.399 15,417,005 5,738,705 1.33.590,313 198,861,589 91,500.865 14.139.443 17,463,431 16,434,518 11,080,831 7.493.724 124825,601 176,105.839 56,502,844 18428,154 5.144,748 416,204,850 494,781,753 16 17 59,521,057 116,507,904 20.829,98 15,955 838 31,387,259 13,166,125 120,703,225 196,858,659 ASSETS Cash and cash equivalents Accounts receivable and prepayments Inventories Financial assets at fair value through profit or loss Financial ses available for sale Investment in associates Property, plant and equipment Intangible assets TOTAL ASSETS LIABILITIES AND EQUITY Liabilities Term loan Payable under la financing Accounts payable and scals Total liabilities Equity Share capital Share premium Treasury shares Tmatury shares reserve Statutory reserve Voluntary reserve Revaluation reserve Foreign currency translation reserve Other reserves Culative changes in fair value Retained earnings Equity attributable te bolders of the Parent Company Non-controlling interest Total equity TOTAL LIABILITIES AND EQUITY 19 20 21 53,483,275 2,400,000 (9.709.966) 1.274,579 26,741,138 25,467.750 4.381,664 1,512.027 19.11906) 149,200.255 45,135,980 53,482,275 2.400.000 9,805,151) 998.971 26,741,138 25,467,750 5,106,784 2,012,734 50,516 128,760,744 60,286,873 295 501.634 290,706.896 7.216,198 297.923,094 494,781,753 295,501634 416.304,859 Her Debbps M Al-Dakous (Chlman Khaled A. Al-Ghanim (Deputy Chairman) The attached notes 1 to 30 form part of the comolidated financial statement Boubyan Petrochemical Company K.S.C.P. and Subsidiaries CONSOLIDATED STATEMENT OF INCOME For the year ended 30 April 2017 2017 KD 2016 KD Noter Sales Cost of sales 25,795,507 (21,801,579) GROSS PROFIT 3.973.928 30,561,908 (25.475.667) 5,086,241 20,141,953 (120,000) 4,141,727 3 10 12 12 12 3,730,898 (918.1080 Divided income Low on financial stat fair value through profit or los Netin on financial stailable for sale Gain on reclification of financial sets available for sale to cite Share of results from so Impairment of associates Impairment of goodwill Impairment of property, plant and equipment General and administrative Expo Fineco Other income Foreign exchangelo Gain on sale of sociale's Rieb Profit before impairment of financial Amets wailable for sale Impairment of financial is wailable for sale PROPTT BEFORE TAXATION AND DIRECTORS PEL Totion Directors' fees 19.322,145 39.43) 62.141 5.911.345 4278,866 (1.398,675) (857,715) (2.726.306) (5,674,310 J.) 216,129 207,143) 13 5 12 (4.608.523) 2.475,611) 989.365 (78,703) 685,437 26,374,277 (2.600.002) 11 19,585,218 (8,761,195) 10,794,033 (317,205) (75,000) 7 23,972,873 (1,058,266) (15,000) PROFIT FOR THE YEAR 10,401,315 22,639,609 BASIC AND DILUTED EARNINGS PER SHARE 20.18 file 43.83 fils


