I don't really know how to answer the question about variability. I added the image of my work. (2 (e) )
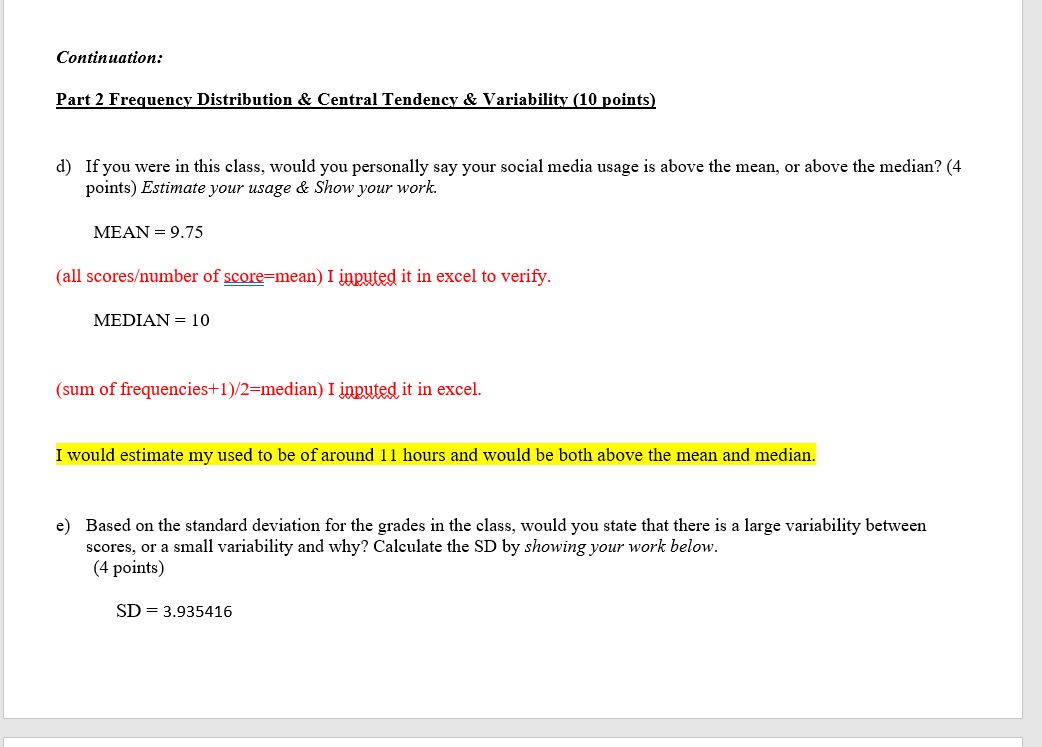
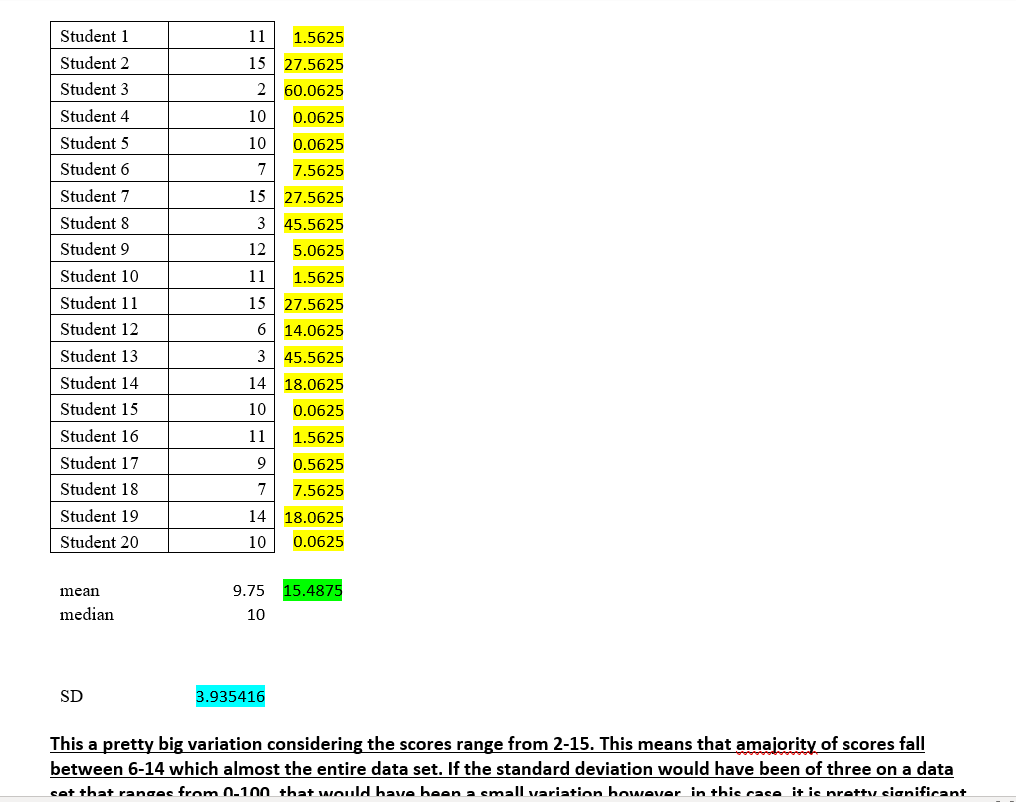
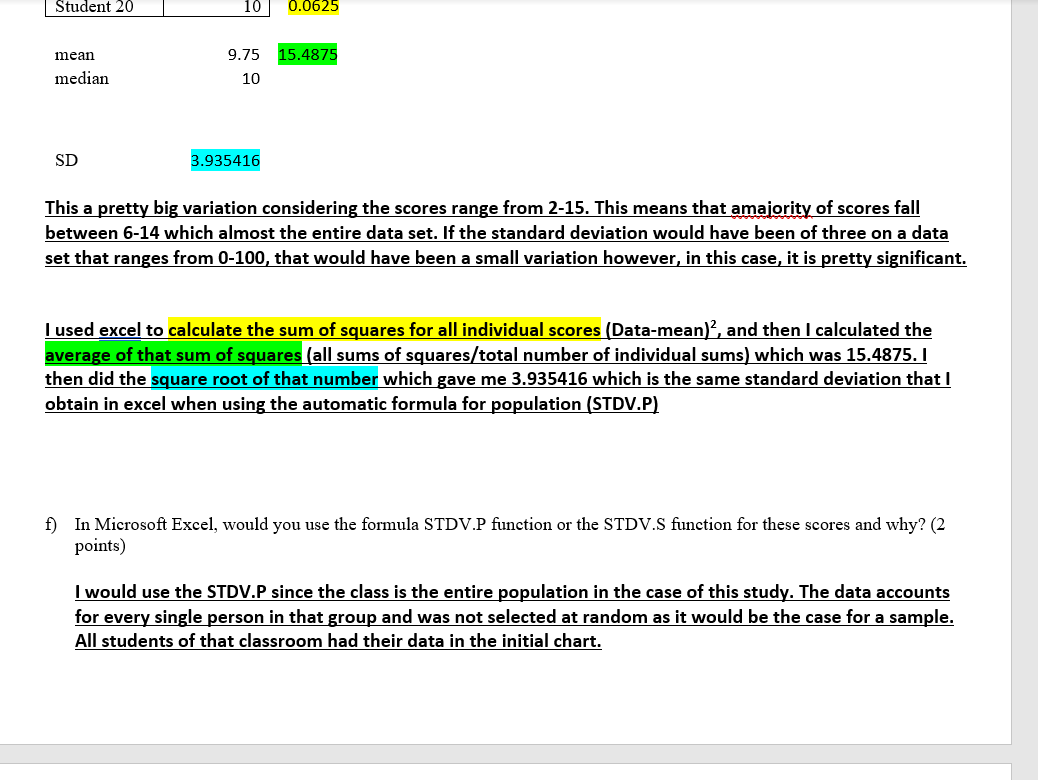
d) Ifyou were in this class, would you personally say your social media usage is above the mean, or above the median? (4 points) Estimate your usage cf: Show your work MEAN = 9.75 (all scoresfnumber of wmean) I W it in excel to verify. MEDIAN = 10 (sum of frequencies+1)f2=median) I Wit in excel. I would estimate my used to be of around 11 hours and would be both above the mean and median. e) Based on the standard deviation for the grades in the class, would you state that there is a large variability between scores, or a small variability and why? Calculate the SD by showingyaur work below. (4 points) SD = 3.935416 Student 1 11 1.5625 Student 2 15 27.5625 Student 3 2 60.0625 Student 4 10 0.0625 Student 5 10 0.0625 Student 6 7 7.5625 Student 7 15 27.5625 Student 8 3 45.5625 Student 9 12 5.0625 Student 10 1.5625 Student 11 15 27.5625 Student 12 6 14.0625 Student 13 3 45.5625 Student 14 14 18.0625 Student 15 10 0.0625 Student 16 1] 1.5625 Student 17 9 0.5625 Student 18 7 7.5625 Student 19 14 18.0625 Student 20 10 0.0625 mean 9.75 15.4875 median 10 SD 3.935416 This a pretty big variation considering the scores range from 2-15. This means that amajority of scores fall between 6-14 which almost the entire data set. If the standard deviation would have been of three on a data cat that ranges from 0-100 that would have haan a emall variation however in this race it is pretty significant| Student 20 | 10| 0.0625 mean 9.7 5 15.4875 median 10 SD 3 .93 541 5 This a pretty big variation considering the scores range from 2-15. This means that amaioritg of scores fall between 6-14 which almost the entire data set. If the standard deviation would have been of three on a data set that ran es from 0-100 that would have been a small variation however in this case it is rett si nificant. I used excel to calculate the sum of squares for all individual scores (lilata-meanlzl and then I calculated the average ofthat sum of squares (all sums of squares/total number of individual sums) which was 15.4875. I then did the square root of that number which gave me 3.935416 which is the same standard deviation that I obtain in excel when using the automatic formula for population (STDV.P} f) In Microsoft Excel, would you. use the formula STDV.P function or the STDVS function for these scores and why? (2 points) I would use the STDV.P since the class is the entire population in the case ofthis study. The data accounts for every single person in that group and was not selected at random as it would be the case for a sample. All students of that classroom had their data in the initial chart