

Answered step by step
Verified Expert Solution
Question
1 Approved Answer
I have a csv file as well that is a table with a lot of numbers but it is too large to upload. Thank you
I have a csv file as well that is a table with a lot of numbers but it is too large to upload. Thank you in advance!!!
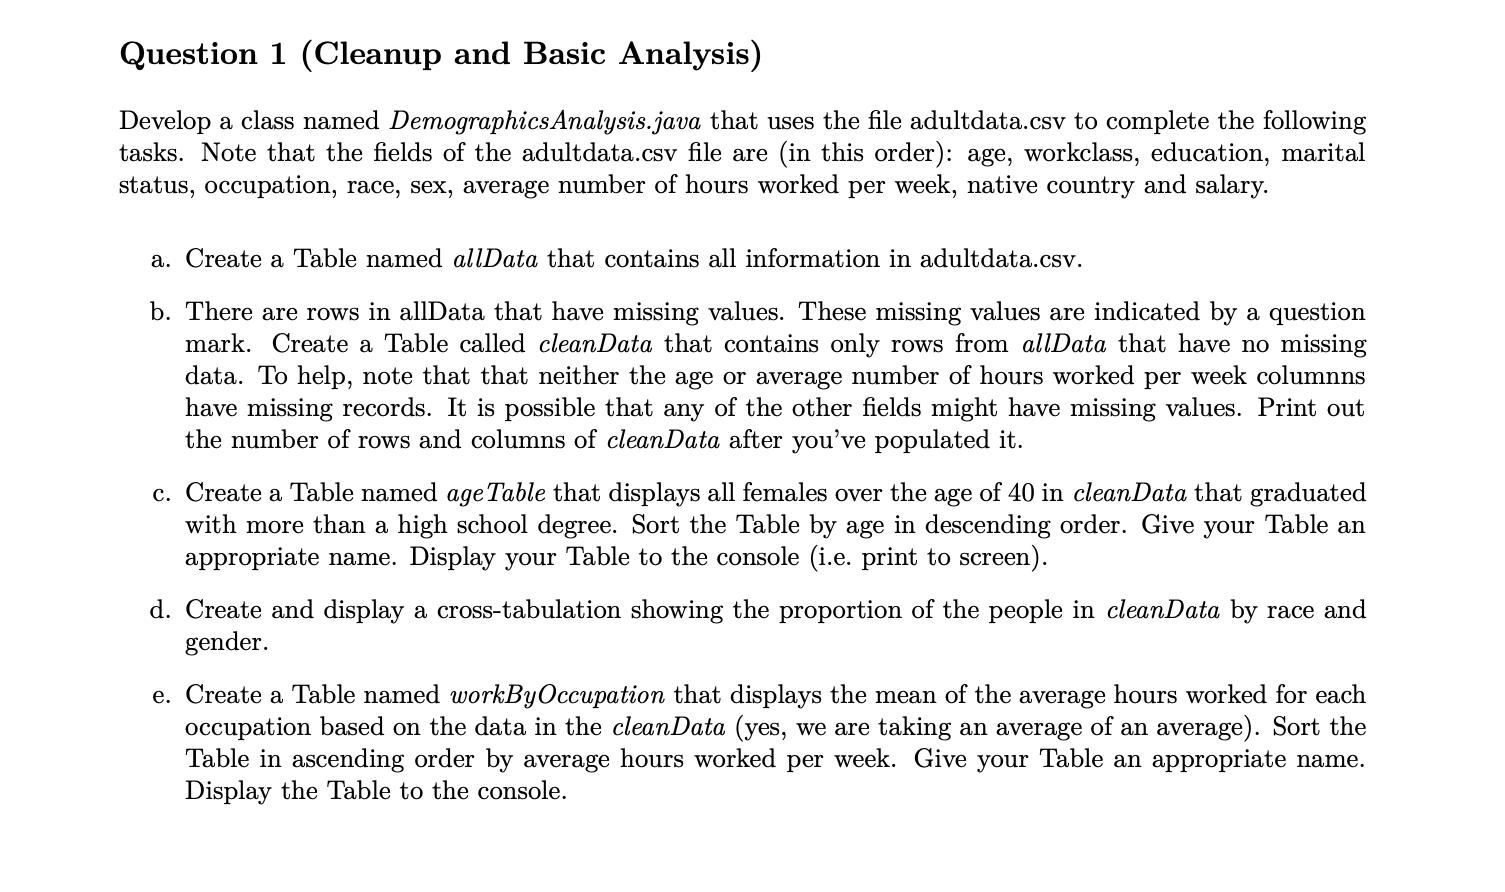
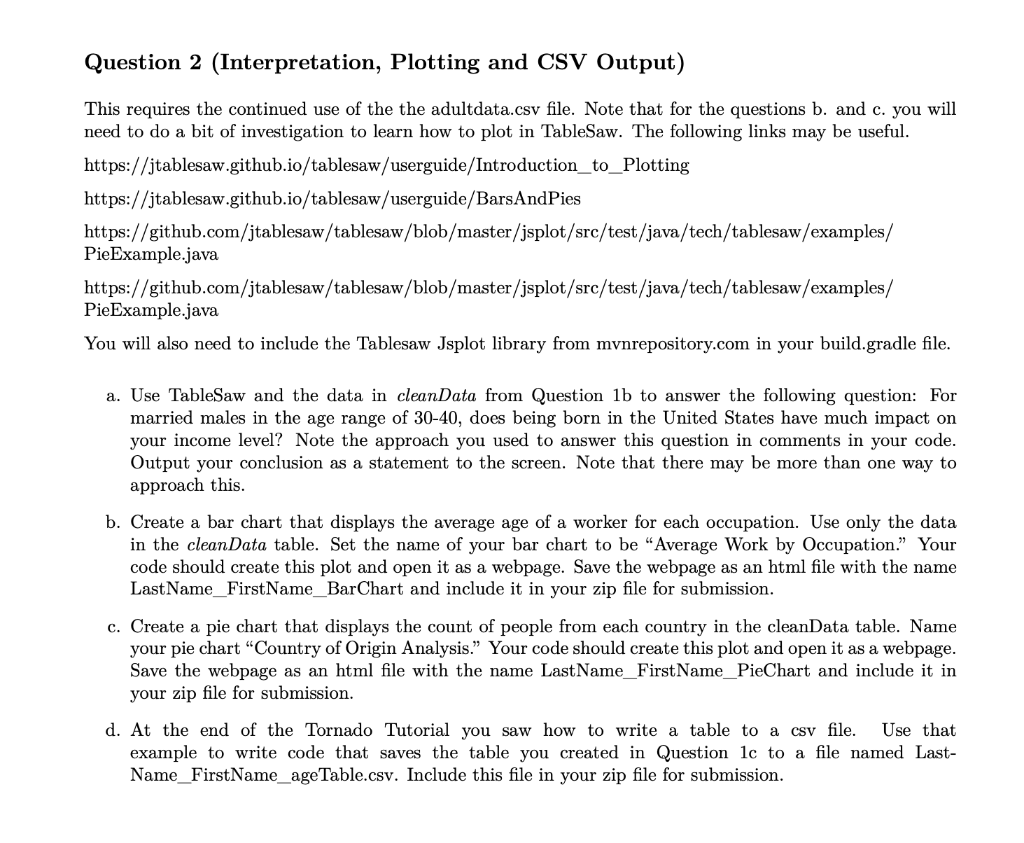
Question 1 (Cleanup and Basic Analysis) Develop a class named Demographics Analysis.java that uses the file adultdata.csv to complete the following tasks. Note that the fields of the adultdata.csv file are (in this order): age, workclass, education, marital status, occupation, race, sex, average number of hours worked per week, native country and salary. a. Create a Table named allData that contains all information in adultdata.csv. b. There are rows in allData that have missing values. These missing values are indicated by a question mark. Create a Table called cleanData that contains only rows from allData that have no missing data. To help, note that that neither the age or average number of hours worked per week columns have missing records. It is possible that any of the other fields might have missing values. Print out the number of rows and columns of clean Data after you've populated it. c. Create a Table named age Table that displays all females over the age of 40 in clean Data that graduated with more than a high school degree. Sort the Table by age in descending order. Give your Table an appropriate name. Display your Table to the console (i.e. print to screen). d. Create and display a cross-tabulation showing the proportion of the people in cleanData by race and gender. e. Create a Table named workByOccupation that displays the mean of the average hours worked for each occupation based on the data in the cleanData (yes, we are taking an average of an average). Sort the Table in ascending order by average hours worked per week. Give your Table an appropriate name. Display the Table to the console. Question 2 (Interpretation, Plotting and CSV Output) This requires the continued use of the the adultdata.csv file. Note that for the questions b. and c. you will need to do a bit of investigation to learn how to plot in TableSaw. The following links may be useful. https://jtablesaw.github.io/tablesaw/userguide/Introduction_to_Plotting https://jtablesaw.github.io/tablesaw/userguide/Bars And Pies https://github.com/jtablesaw/tablesaw/blob/master/jsplot/src/test/java/tech/tablesaw/examples/ PieExample.java https://github.com/jtablesaw/tablesaw/blob/master/jsplot/src/test/java/tech/tablesaw/examples/ PieExample.java You will also need to include the Tablesaw Jsplot library from mynrepository.com in your build.gradle file. a. Use TableSaw and the data in clean Data from Question lb to answer the following question: For married males in the age range of 30-40, does being born in the United States have much impact on your income level? Note the approach you used to answer this question in comments in your code. Output your conclusion as a statement to the screen. Note that there may be more than one way to approach this. b. Create a bar chart that displays the average age of a worker for each occupation. Use only the data in the clean Data table. Set the name of your bar chart to be Average Work by Occupation. Your code should create this plot and open it as a webpage. Save the webpage as an html file with the name LastName_FirstName_BarChart and include it in your zip file for submission. c. Create a pie chart that displays the count of people from each country in the cleanData table. Name your pie chart "Country of Origin Analysis." Your code should create this plot and open it as a webpage. Save the webpage as an html file with the name LastName_FirstName_PieChart and include it in your zip file for submission. d. At the end of the Tornado Tutorial you saw how to write a table to a csv file. Use that example to write code that saves the table you created in Question lc to a file named Last- Name_FirstName_age Table.csv. Include this file in your zip file for submission. Question 1 (Cleanup and Basic Analysis) Develop a class named Demographics Analysis.java that uses the file adultdata.csv to complete the following tasks. Note that the fields of the adultdata.csv file are (in this order): age, workclass, education, marital status, occupation, race, sex, average number of hours worked per week, native country and salary. a. Create a Table named allData that contains all information in adultdata.csv. b. There are rows in allData that have missing values. These missing values are indicated by a question mark. Create a Table called cleanData that contains only rows from allData that have no missing data. To help, note that that neither the age or average number of hours worked per week columns have missing records. It is possible that any of the other fields might have missing values. Print out the number of rows and columns of clean Data after you've populated it. c. Create a Table named age Table that displays all females over the age of 40 in clean Data that graduated with more than a high school degree. Sort the Table by age in descending order. Give your Table an appropriate name. Display your Table to the console (i.e. print to screen). d. Create and display a cross-tabulation showing the proportion of the people in cleanData by race and gender. e. Create a Table named workByOccupation that displays the mean of the average hours worked for each occupation based on the data in the cleanData (yes, we are taking an average of an average). Sort the Table in ascending order by average hours worked per week. Give your Table an appropriate name. Display the Table to the console. Question 2 (Interpretation, Plotting and CSV Output) This requires the continued use of the the adultdata.csv file. Note that for the questions b. and c. you will need to do a bit of investigation to learn how to plot in TableSaw. The following links may be useful. https://jtablesaw.github.io/tablesaw/userguide/Introduction_to_Plotting https://jtablesaw.github.io/tablesaw/userguide/Bars And Pies https://github.com/jtablesaw/tablesaw/blob/master/jsplot/src/test/java/tech/tablesaw/examples/ PieExample.java https://github.com/jtablesaw/tablesaw/blob/master/jsplot/src/test/java/tech/tablesaw/examples/ PieExample.java You will also need to include the Tablesaw Jsplot library from mynrepository.com in your build.gradle file. a. Use TableSaw and the data in clean Data from Question lb to answer the following question: For married males in the age range of 30-40, does being born in the United States have much impact on your income level? Note the approach you used to answer this question in comments in your code. Output your conclusion as a statement to the screen. Note that there may be more than one way to approach this. b. Create a bar chart that displays the average age of a worker for each occupation. Use only the data in the clean Data table. Set the name of your bar chart to be Average Work by Occupation. Your code should create this plot and open it as a webpage. Save the webpage as an html file with the name LastName_FirstName_BarChart and include it in your zip file for submission. c. Create a pie chart that displays the count of people from each country in the cleanData table. Name your pie chart "Country of Origin Analysis." Your code should create this plot and open it as a webpage. Save the webpage as an html file with the name LastName_FirstName_PieChart and include it in your zip file for submission. d. At the end of the Tornado Tutorial you saw how to write a table to a csv file. Use that example to write code that saves the table you created in Question lc to a file named Last- Name_FirstName_age Table.csv. Include this file in your zip file for submissionStep by Step Solution
There are 3 Steps involved in it
Step: 1

Get Instant Access to Expert-Tailored Solutions
See step-by-step solutions with expert insights and AI powered tools for academic success
Step: 2

Step: 3
Ace Your Homework with AI
Get the answers you need in no time with our AI-driven, step-by-step assistance
Get Started
The Manga Guide To Databases
Authors: Mana Takahashi, Shoko Azuma, Co Ltd Trend
1st Edition
1593271905, 978-1593271909