Answered step by step
Verified Expert Solution
Question
1 Approved Answer
i have a sample set of 50 stocks for this data i want the code in matlab and its explantions. also the how to calculate
i have a sample set of 50 stocks for this data i want the code in matlab and its explantions. also the how to calculate risk free rate as the sample doesn't have risk free rate.

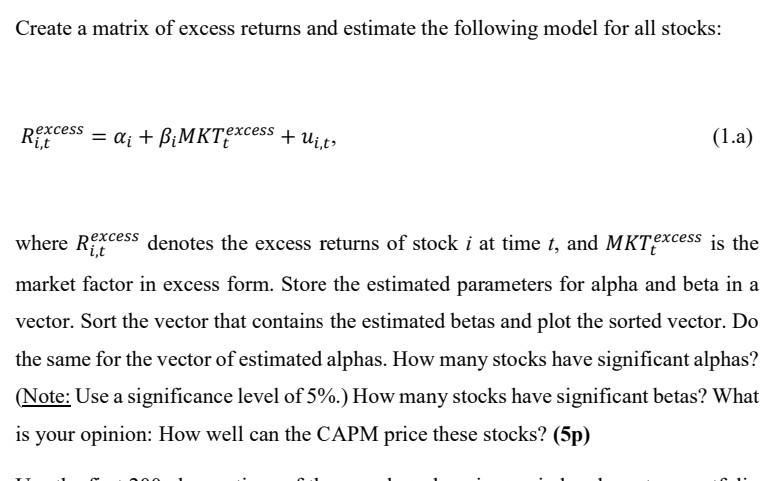
Create a matrix of excess returns and estimate the following model for all stocks: Ri,texcess=i+iMKTtexcess+ui,t, where Ri,texcess denotes the excess returns of stock i at time t, and MKTtexcess is the market factor in excess form. Store the estimated parameters for alpha and beta in a vector. Sort the vector that contains the estimated betas and plot the sorted vector. Do the same for the vector of estimated alphas. How many stocks have significant alphas? (Note: Use a significance level of 5\%.) How many stocks have significant betas? What is your opinion: How well can the CAPM price these stocks? (5p)
Step by Step Solution
There are 3 Steps involved in it
Step: 1

Get Instant Access to Expert-Tailored Solutions
See step-by-step solutions with expert insights and AI powered tools for academic success
Step: 2

Step: 3

Ace Your Homework with AI
Get the answers you need in no time with our AI-driven, step-by-step assistance
Get Started


