Answered step by step
Verified Expert Solution
Link Copied!

Question

1 Approved Answer

I have run my data on excel sheet and got the regression summary table. I have uploaded the regression summary table. SUMMARY OUTPUT Regression Statistics

I have run my data on excel sheet and got the regression summary table. I have uploaded the regression summary table.
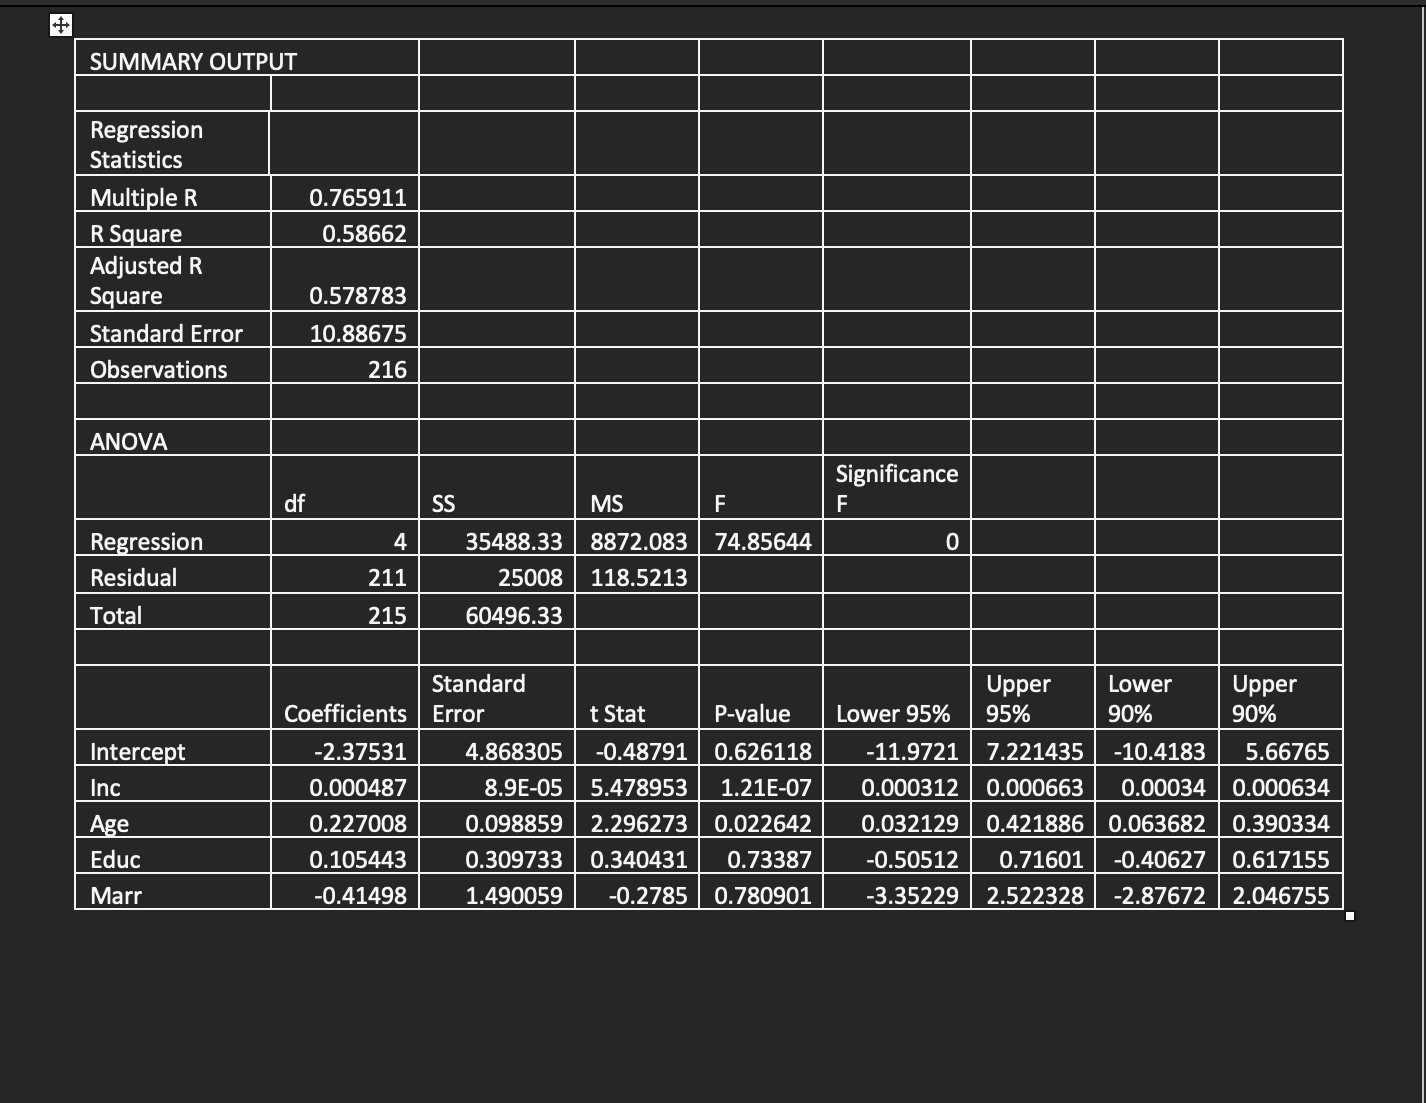
image text in transcribed
SUMMARY OUTPUT Regression Statistics Multiple R 0.765911 R Square 0.58662 Adjusted R Square 0.578783 Standard Error 10.88675 Observations 216 ANOVA Significance df SS MS F F Regression 4 35488.33 8872.083 74.85644 0 Residual 211 25008 118.5213 Total 215 60496.33 Standard Upper Lower Upper Coefficients Error t Stat P-value Lower 95% 95% 90% 90% Intercept -2.37531 4.868305 -0.48791 0.626118 -11.9721 7.221435 -10.4183 5.66765 Inc 0.000487 8.9E-05 5.478953 1.21E-07 0.000312 0.000663 0.00034 0.000634 Age 0.227008 0.098859 2.296273 0.022642 0.032129 0.421886 0.063682 0.390334 Educ 0.105443 0.309733 0.340431 0.73387 0.50512 0.71601 0.40627 0.617155 Marr -0.41498 1.490059 -0.2785 0.780901 -3.35229 2.522328 -2.87672 2.046755

Step by Step Solution

There are 3 Steps involved in it

Step: 1

blur-text-image

Get Instant Access to Expert-Tailored Solutions

See step-by-step solutions with expert insights and AI powered tools for academic success

Step: 2

blur-text-image

Step: 3

blur-text-image

Ace Your Homework with AI

Get the answers you need in no time with our AI-driven, step-by-step assistance

Get Started

Recommended Textbook for

Mathematics Concepts With Applications

Authors: Charles P McKeague

1st Edition

1630983136, 9781630983130

More Books

Students also viewed these Mathematics questions

Question

7) Counter-Controlled Loops for (cotmt=1; count

Answered: 1 week ago