Answered step by step
Verified Expert Solution
Question
1 Approved Answer
I have this question above from an assignment.There are numerous solutions to this question but I will give you what our profs solution is.What I
I have this question above from an assignment.There are numerous solutions to this question but I will give you what our profs solution is.What I don't understand is why he uses $75,000 for the defender's O/M (operation and maintenance cost) given in the question for annual saving for the challenger,instead of $30,000 given in the question for the defender? Is it not $75,000 suppose to be $30,000 in the solution? He also never uses $30,000 in the defender's income statement.He also never uses $75,000 in the challenger's income statement.
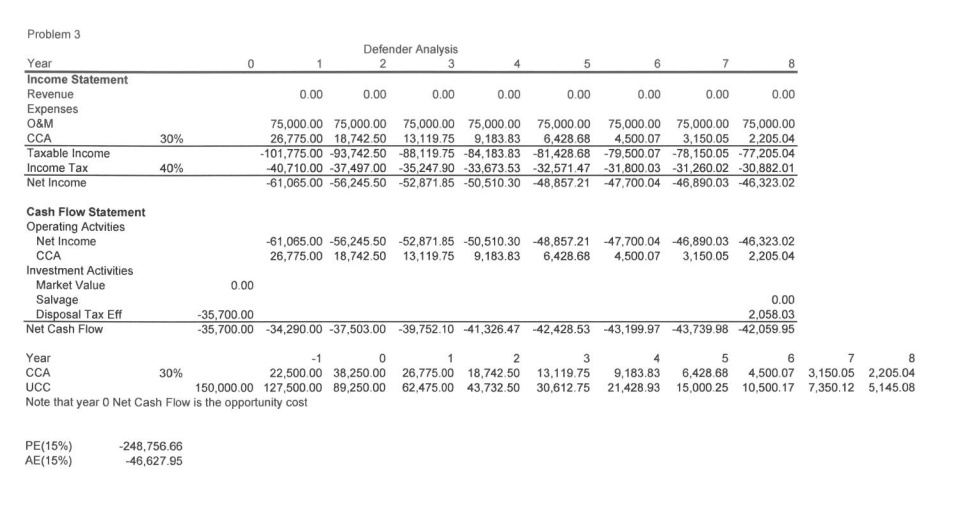
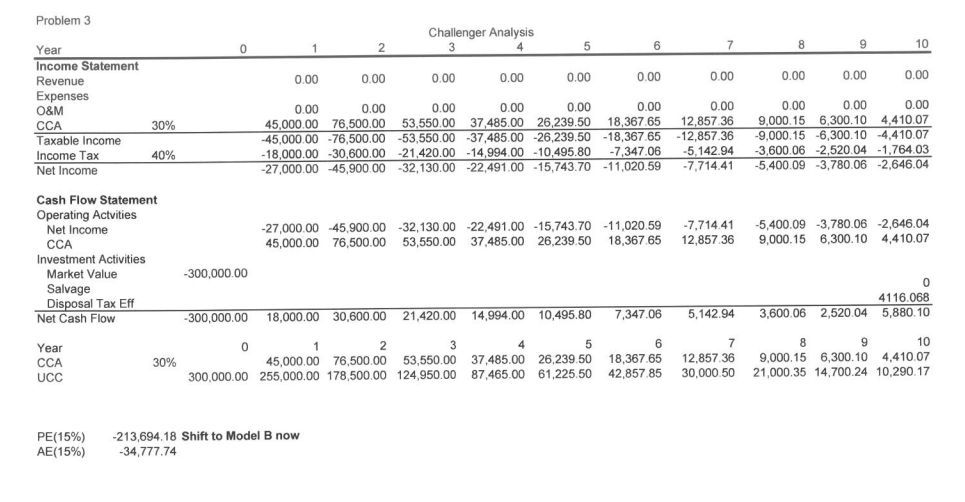
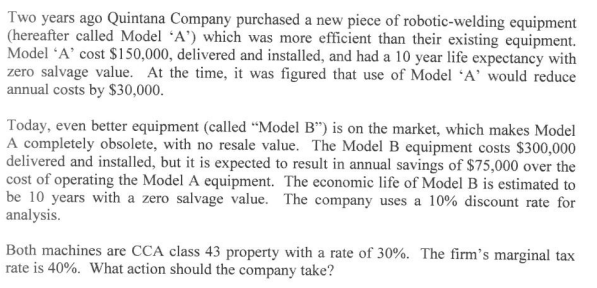
Two years ago Quintana Company purchased a new piece of robotic-welding equipment Model 'A' cost $150,000, delivered and installed, and had a 10 year life expectancy with annual costs by $30,000 (hereafter called Model 'A') which was more efficient than their existing equipment zero salvage value. At the time, it was figured that use of Model 'A would reduce Today, even better equipment (called "Model B") is on the market, which makes Model A completely obsolete, with no resale value. The Model B equipment costs $300,000 delivered and installed, but it is expected to result in annual savings of $75,000 over the cost of operating the Model A equipment. The economic life of Model B is estimated to be 10 years with a zero salvage value. The company uses a 10% discount rate for analysis Both machines are CCA class 43 property with a rate of 30%. The firm's marginal tax rate is 40%. What action should the company take? Problem 3 Defender Analysis Year Income Statement Revenue Expenses O&M CCA Taxable Income Income Tax Net Income 0.00 0.00 0.00 0.00 0.00 0.00 0.00 0.00 75,000.00 75,000.00 75,000.00 75,000.00 75,000.00 75,000.00 75,000.00 75,000.00 26,775.00 18,742.50 13,119.75 9,183.83 6,428.68 4,500.07 3,150.05 2,205.04 101,775.00 -93,742.50 -88,119.75 -84,183.83 -81,428.68 79,500.07 -78,150.05 -77,205.04 40,710.00 -37,497.00 -35,247.90 -33,673.53 -32,571.47 -31,800.03-31,260.02 -30,882.01 61,065.00 -56,245.50 -52,871.85 -50,510.30 48,857.21 47,700.04-46,890.03 -46,323.02 40% Cash Flow Statement Operating Actvities Net Income CCA 61,065.00 -56,245.50 -52,871.85-50,510.30 -48,857.2 -47,700.04 -46,890.03 46,323.02 26,775.00 18,742.50 13,119.75 9,183.83 6,428.68 4,500.07 3,150.05 2,205.04 Investment Activities Market Value Salvage Disposal Tax Eff 0.00 0.00 2,058.03 35,700.00 -34,290.00 -37,503.00 -39,752.10-41,326.47 -42,428.53 -43,199.97 -43,739.98 -42,059.95 35,700.00 Net Cash Flow Year CCA UCC Note that year 0 Net Cash Flow is the opportunity cost 6 22,500.00 38,250.00 26,775.00 18,742.50 13,119.759,183.83 6,428.68 4,500.073,150.05 2,205.04 50,000.00 127,500.00 89,250.00 62,475.00 43,732.50 30,612.75 21,428.93 15,000.25 10,500.17 7,350.12 5,145.08 30% PE(15%) AE(15%) 248,756.66 46,627.95 Problem 3 Challenger Analysis 0 Year Income Statement Revenue 0.000.00 0.000.000.00 0.00 0.00 0.000.00 0.00 0.000.00 45,000.00 76,500.00 53,550.00 37485.00 26.23950 18,3676512,857 369,000.15 6,300.10 4.410.07 45,000.00 -76,500.00 -53,550.00 -37,485.00 -26,239.50 -18,367.65 12,857.36 9,000.15 -6,300.10 -4,410.07 18,000.00 -30,600.00 -21.420.00 -14,994.00 -10,495.80734706-5142.943,600.06-2,520.04 -1.764.03 27,000.00 45,900.00 -32,130.00 -22,491.00 -15,743.70 -11,020.59 -7,714.41 -5,400.09 -3,780.06 -2,646.04 0.00 0.00 0.00 O&M CCA Taxable Income Income Tax Net Income 2 30% Cash Flow Statement Operating Actvities 27,000.00 -45,900.00 -32,130.00 -22,491.00 -15,743.70 11,020.59 -7,714.41 -5,400.09 -3,780.06 -2,646.04 45,000.00 76,500.00 53,550.00 37,485.00 26,239.50 18,36765 12,857 36 9,000.15 6,300.10 4,410.07 2 Net Income Investment Activities -300,000.00 Market Value Salvage Disposal Tax Eff 4116.068 Net Cash Flow 300,000.00 18,000.00 30,600.00 21,420.00 14,994.00 10,495.80 7,34706 5,142.94 3,600.06 2,520.04 5,880.10 5 45,000.00 76,500.00 53,550.00 37,485.00 26,23950 18,367.65 12,857.36 9,000.15 6,300.10 4,410.07 300,000.00 255,000.00 178,500.00 124,950.00 87,465.00 61,225.50 42,857.85 30,000.50 21,000.35 14,700.24 10,290.17 30% UCC -213,604.18 Shift to Model B now PE(15%) AE(1596) -3477774 Two years ago Quintana Company purchased a new piece of robotic-welding equipment Model 'A' cost $150,000, delivered and installed, and had a 10 year life expectancy with annual costs by $30,000 (hereafter called Model 'A') which was more efficient than their existing equipment zero salvage value. At the time, it was figured that use of Model 'A would reduce Today, even better equipment (called "Model B") is on the market, which makes Model A completely obsolete, with no resale value. The Model B equipment costs $300,000 delivered and installed, but it is expected to result in annual savings of $75,000 over the cost of operating the Model A equipment. The economic life of Model B is estimated to be 10 years with a zero salvage value. The company uses a 10% discount rate for analysis Both machines are CCA class 43 property with a rate of 30%. The firm's marginal tax rate is 40%. What action should the company take? Problem 3 Defender Analysis Year Income Statement Revenue Expenses O&M CCA Taxable Income Income Tax Net Income 0.00 0.00 0.00 0.00 0.00 0.00 0.00 0.00 75,000.00 75,000.00 75,000.00 75,000.00 75,000.00 75,000.00 75,000.00 75,000.00 26,775.00 18,742.50 13,119.75 9,183.83 6,428.68 4,500.07 3,150.05 2,205.04 101,775.00 -93,742.50 -88,119.75 -84,183.83 -81,428.68 79,500.07 -78,150.05 -77,205.04 40,710.00 -37,497.00 -35,247.90 -33,673.53 -32,571.47 -31,800.03-31,260.02 -30,882.01 61,065.00 -56,245.50 -52,871.85 -50,510.30 48,857.21 47,700.04-46,890.03 -46,323.02 40% Cash Flow Statement Operating Actvities Net Income CCA 61,065.00 -56,245.50 -52,871.85-50,510.30 -48,857.2 -47,700.04 -46,890.03 46,323.02 26,775.00 18,742.50 13,119.75 9,183.83 6,428.68 4,500.07 3,150.05 2,205.04 Investment Activities Market Value Salvage Disposal Tax Eff 0.00 0.00 2,058.03 35,700.00 -34,290.00 -37,503.00 -39,752.10-41,326.47 -42,428.53 -43,199.97 -43,739.98 -42,059.95 35,700.00 Net Cash Flow Year CCA UCC Note that year 0 Net Cash Flow is the opportunity cost 6 22,500.00 38,250.00 26,775.00 18,742.50 13,119.759,183.83 6,428.68 4,500.073,150.05 2,205.04 50,000.00 127,500.00 89,250.00 62,475.00 43,732.50 30,612.75 21,428.93 15,000.25 10,500.17 7,350.12 5,145.08 30% PE(15%) AE(15%) 248,756.66 46,627.95 Problem 3 Challenger Analysis 0 Year Income Statement Revenue 0.000.00 0.000.000.00 0.00 0.00 0.000.00 0.00 0.000.00 45,000.00 76,500.00 53,550.00 37485.00 26.23950 18,3676512,857 369,000.15 6,300.10 4.410.07 45,000.00 -76,500.00 -53,550.00 -37,485.00 -26,239.50 -18,367.65 12,857.36 9,000.15 -6,300.10 -4,410.07 18,000.00 -30,600.00 -21.420.00 -14,994.00 -10,495.80734706-5142.943,600.06-2,520.04 -1.764.03 27,000.00 45,900.00 -32,130.00 -22,491.00 -15,743.70 -11,020.59 -7,714.41 -5,400.09 -3,780.06 -2,646.04 0.00 0.00 0.00 O&M CCA Taxable Income Income Tax Net Income 2 30% Cash Flow Statement Operating Actvities 27,000.00 -45,900.00 -32,130.00 -22,491.00 -15,743.70 11,020.59 -7,714.41 -5,400.09 -3,780.06 -2,646.04 45,000.00 76,500.00 53,550.00 37,485.00 26,239.50 18,36765 12,857 36 9,000.15 6,300.10 4,410.07 2 Net Income Investment Activities -300,000.00 Market Value Salvage Disposal Tax Eff 4116.068 Net Cash Flow 300,000.00 18,000.00 30,600.00 21,420.00 14,994.00 10,495.80 7,34706 5,142.94 3,600.06 2,520.04 5,880.10 5 45,000.00 76,500.00 53,550.00 37,485.00 26,23950 18,367.65 12,857.36 9,000.15 6,300.10 4,410.07 300,000.00 255,000.00 178,500.00 124,950.00 87,465.00 61,225.50 42,857.85 30,000.50 21,000.35 14,700.24 10,290.17 30% UCC -213,604.18 Shift to Model B now PE(15%) AE(1596) -3477774
Step by Step Solution
There are 3 Steps involved in it
Step: 1

Get Instant Access to Expert-Tailored Solutions
See step-by-step solutions with expert insights and AI powered tools for academic success
Step: 2

Step: 3
Ace Your Homework with AI
Get the answers you need in no time with our AI-driven, step-by-step assistance
Get Started